Blog
Data Science Learning Journey
I am going to record what I have learnt and milestones about data science.
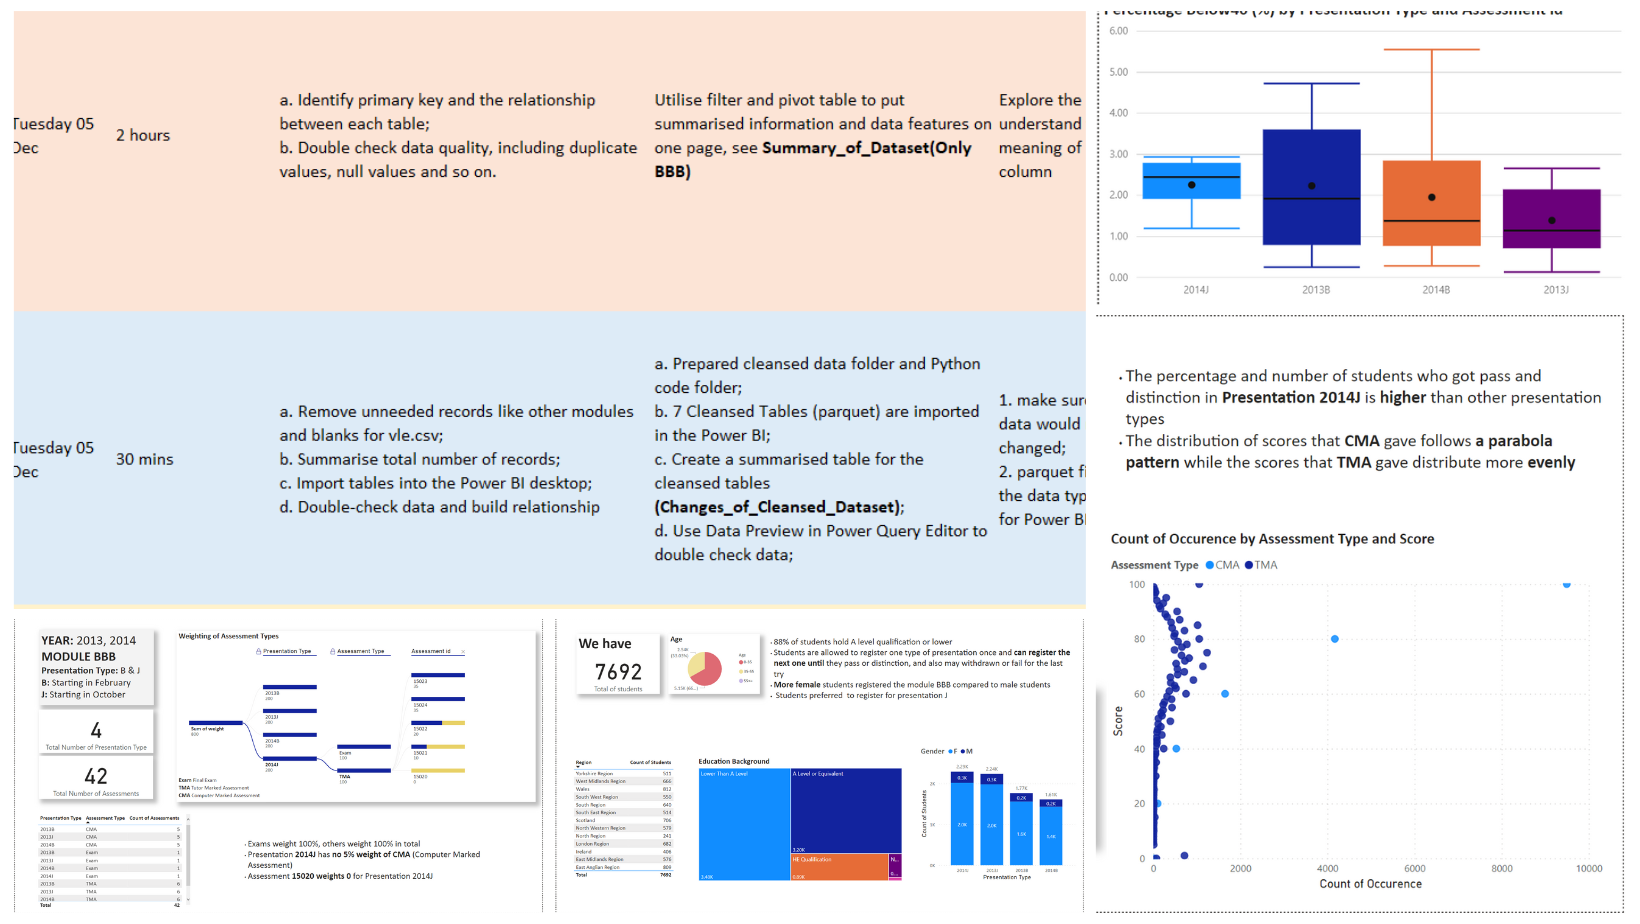
Education-Focused Analysis: How Assessment Types Shape the Final Result
I used Power BI to explore the reasons why the mix and weightings of assessment types shaped the final result
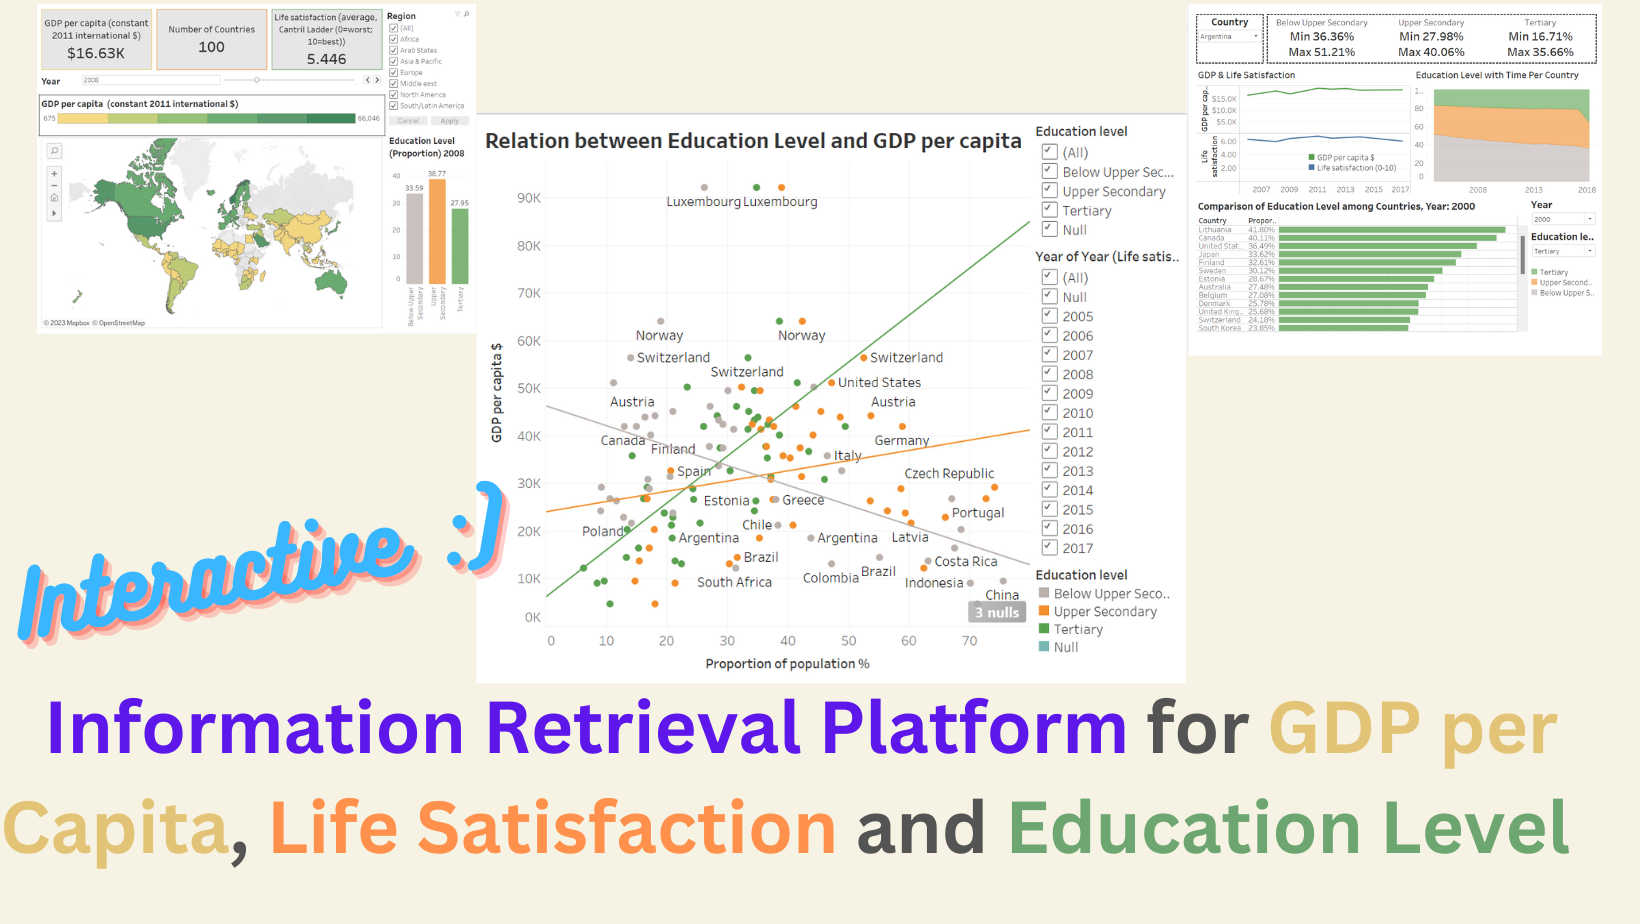
A self-service platform for GDP, Life Satisfaction and Education Level
I used Tableau to build a self-service platform including information about GDP, Life Satisfaction and Education Level
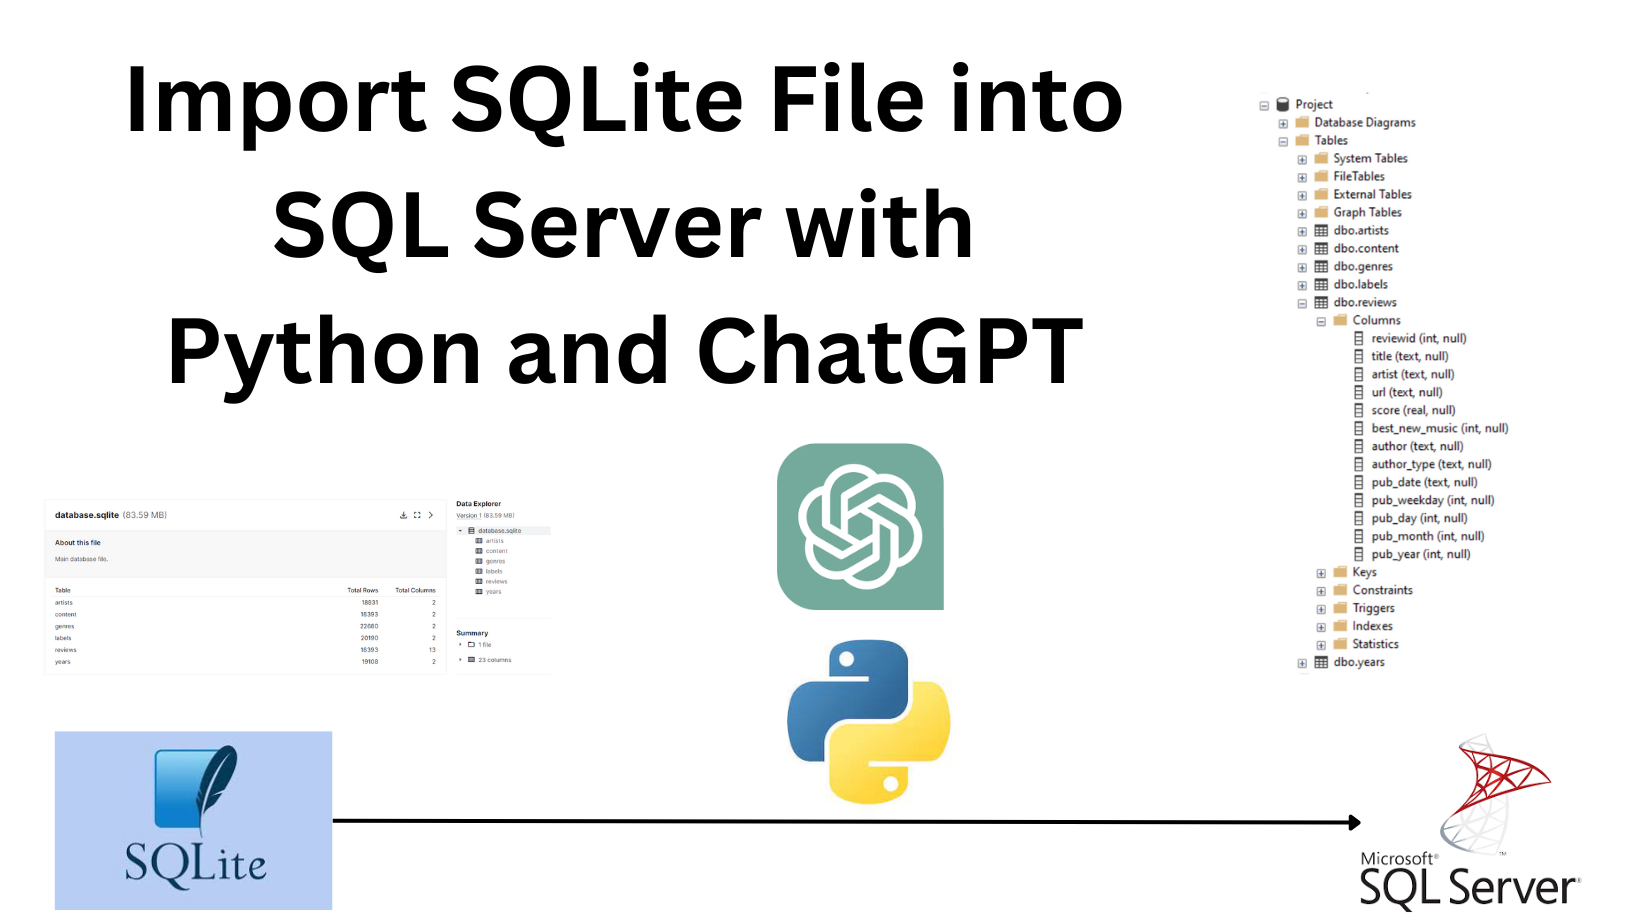
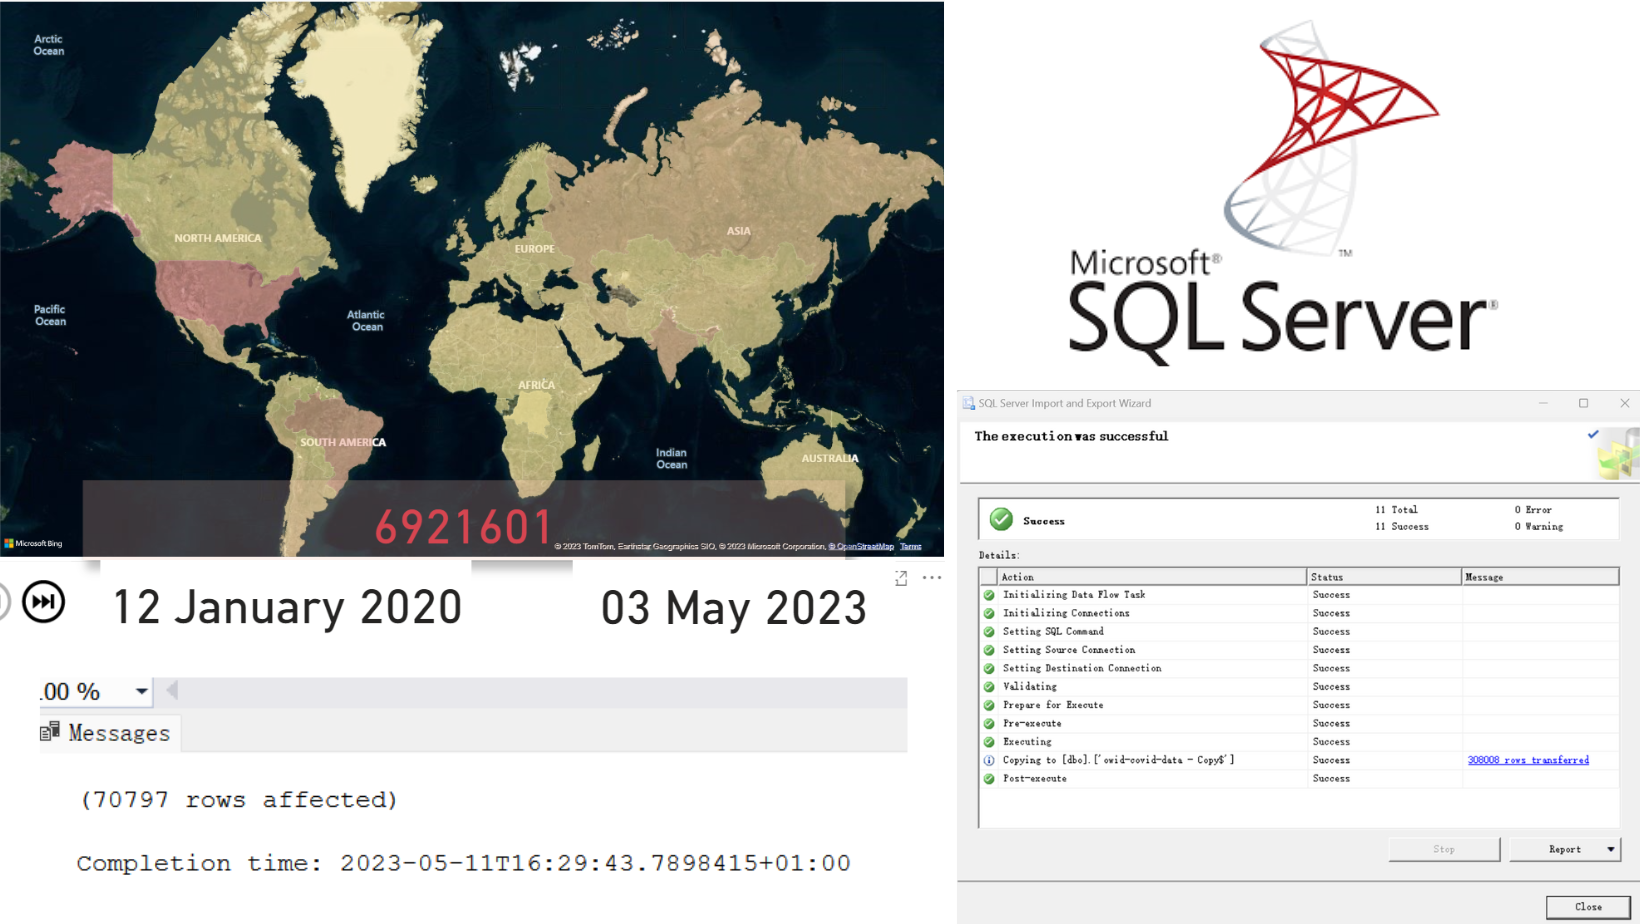
Import SQLite File into SQL Server with Python and ChatGPT
I learn how to use ChatGPT help achieve the connection between SQLite file and SQL Server with Python。
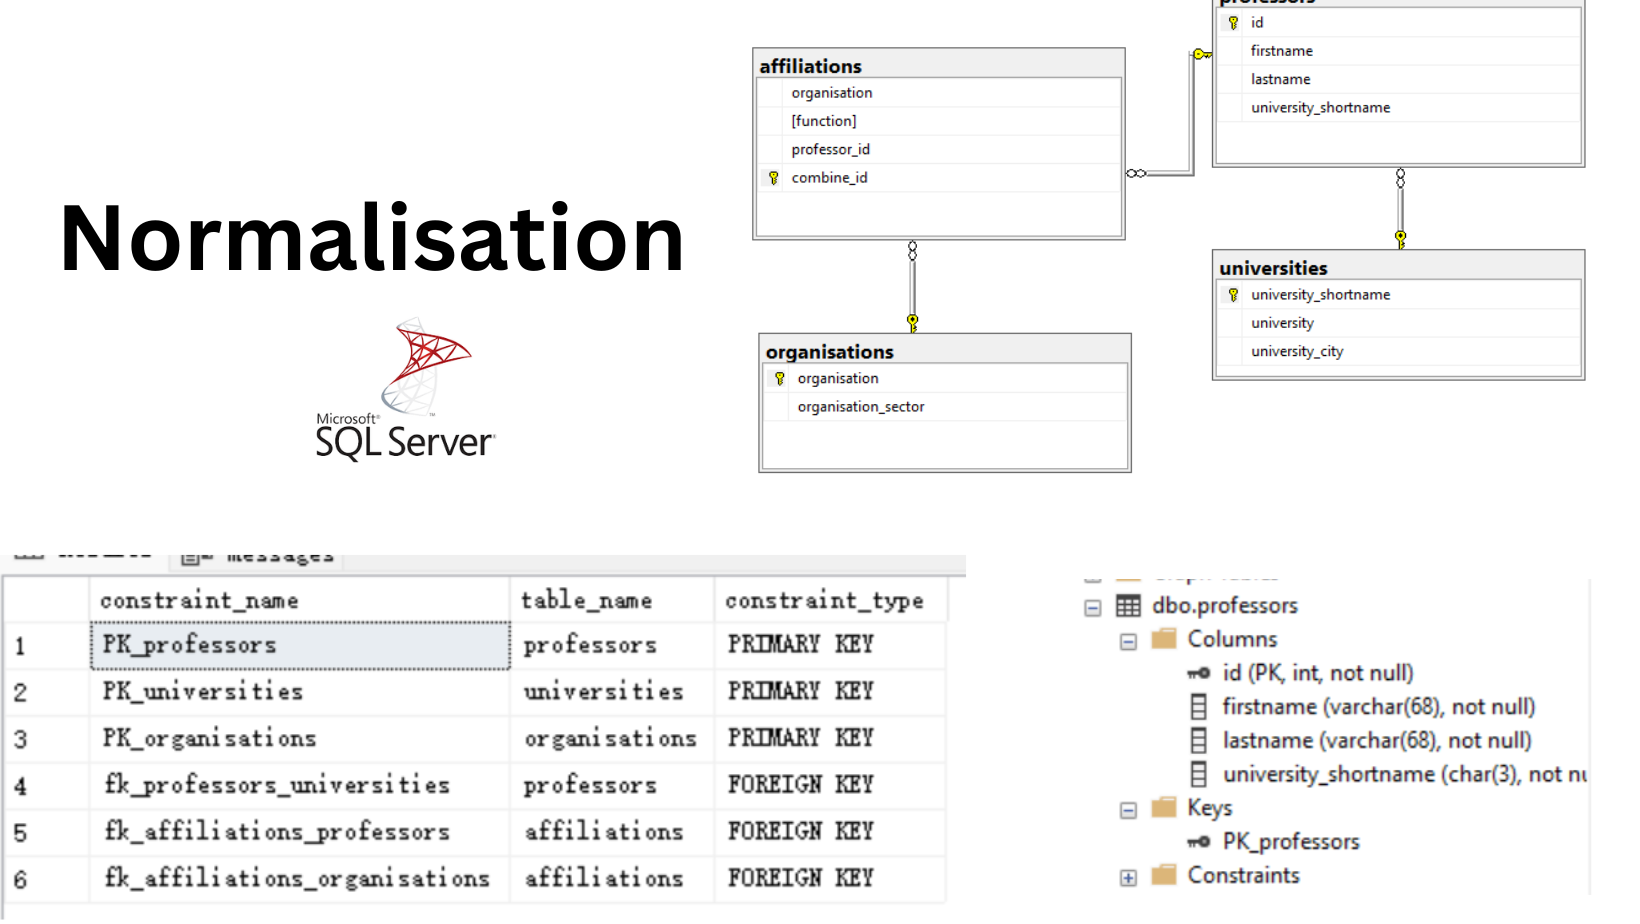
Normalisation for professors in organisations with SQL Server
I used SQL Server to normalise a informative table. The project focused on details, like primary key, surrogate key, relationship, ON DELETE NO ACTION and so on.
3 Steps to Clean Data in SQL Server
I change my on-premise SQL tool to SQL Server now. I prepared clean data for data visualisation, there are 3 main steps to do.
.png)
5 Tips to Store an online zip file locally(Python)
In my first blog, I talked about how to create a more structured directory technically, including f-strings, os module, requests and ZipFile library.
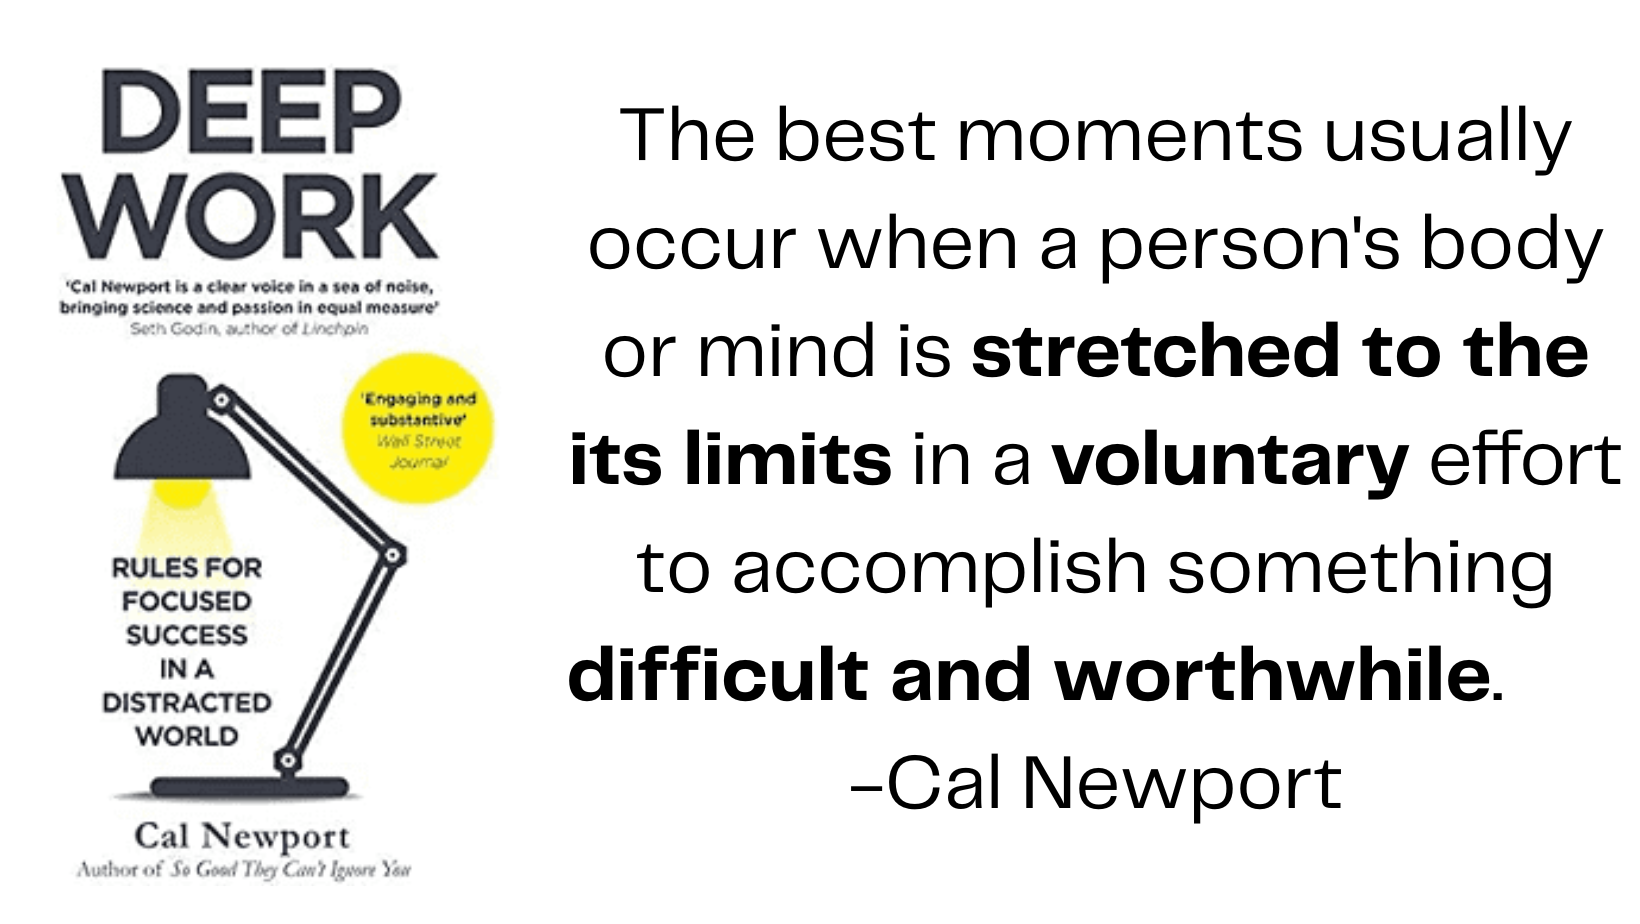
Deep Work Author: Cal Newport
If you want to become a knowledge worker, prioritising deep work is crucial.
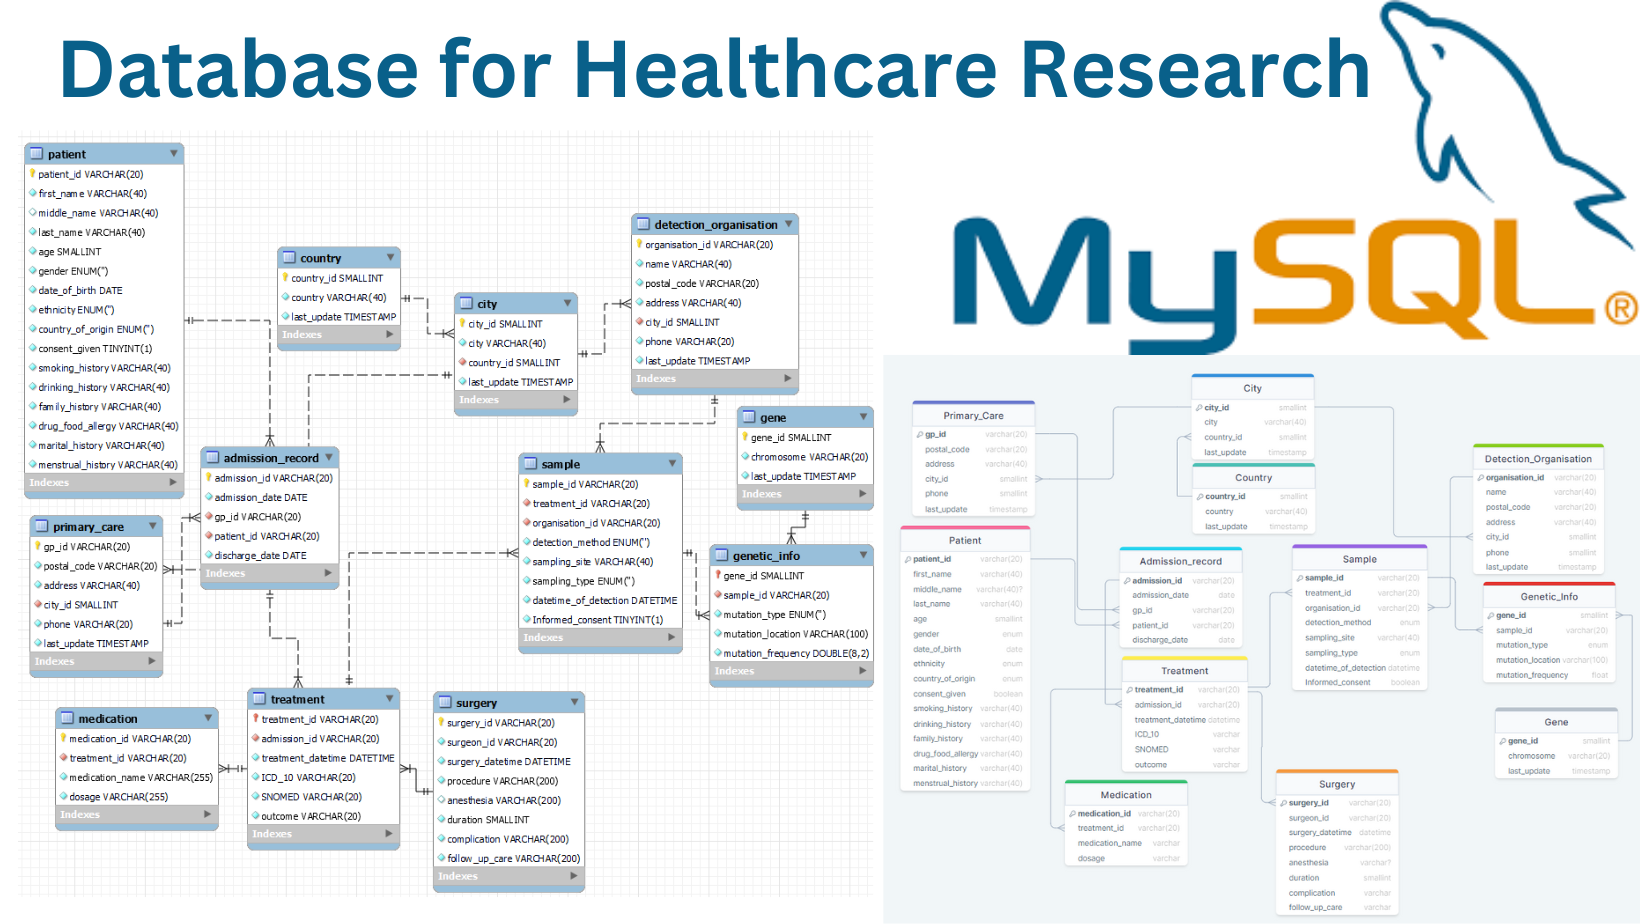
Data Platform Design for Healthcare Research
I used MySQL to create 11 tables for normalisation of clinical data and genetic data. The work is designed for healthcare research.
.png)
BT Customer Churn Influencer
I used Power BI to visualise the features of churn customers in BT and used Python and logistic regression to calculate the key churn influencers.
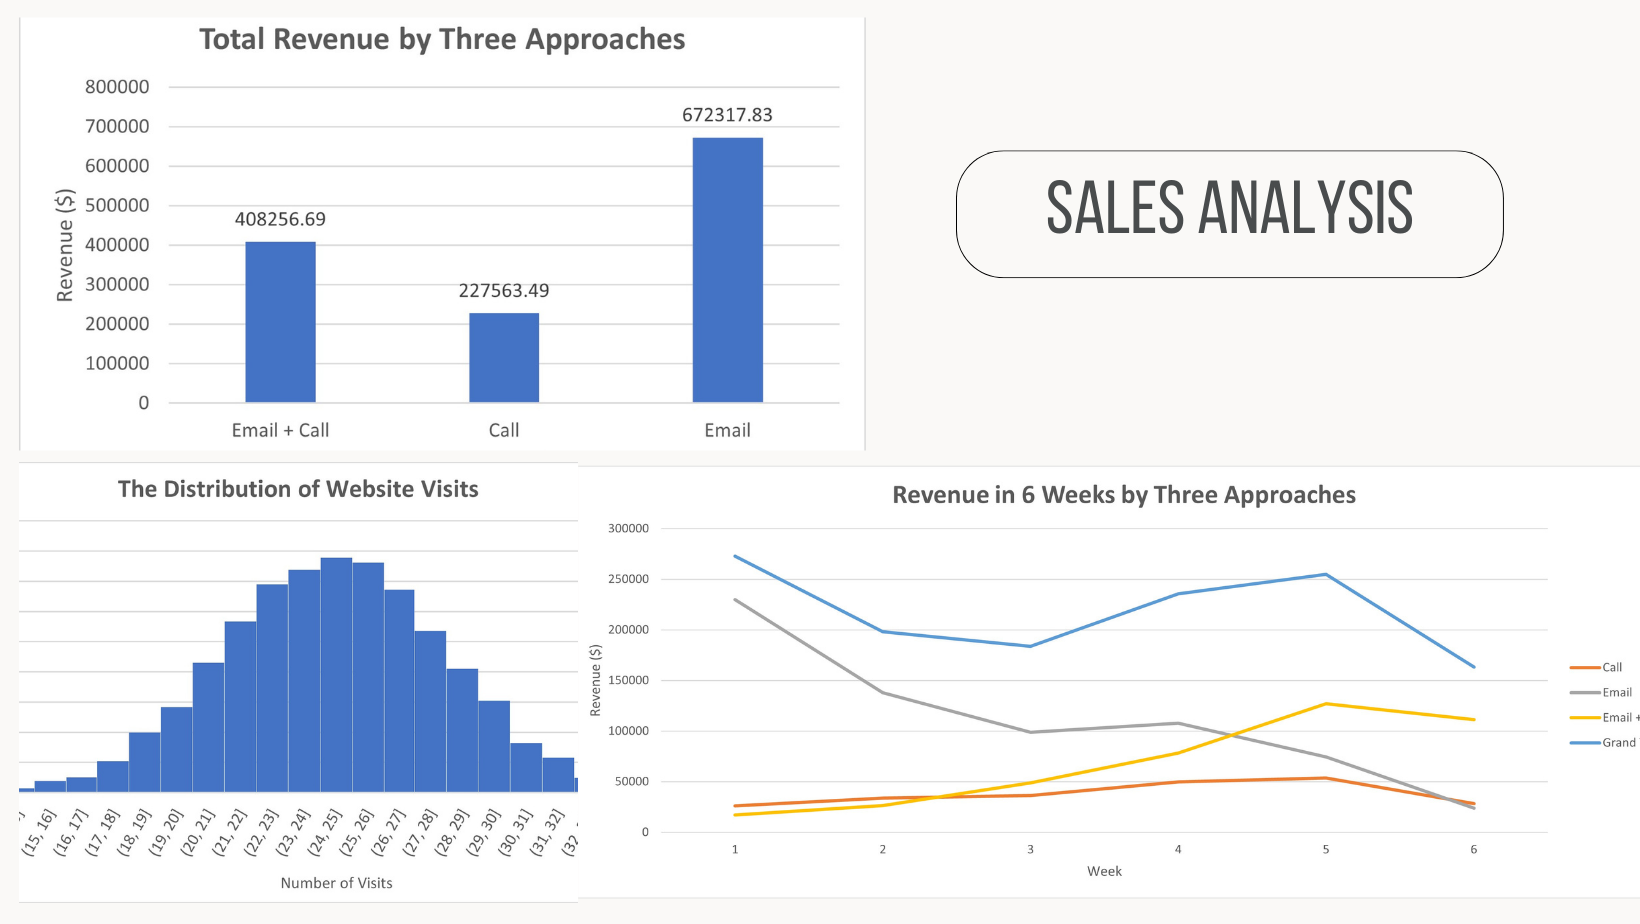
Boosting Revenues through Strategic Sales Analysis (DataCamp Capstone Project)
Tool: Excel
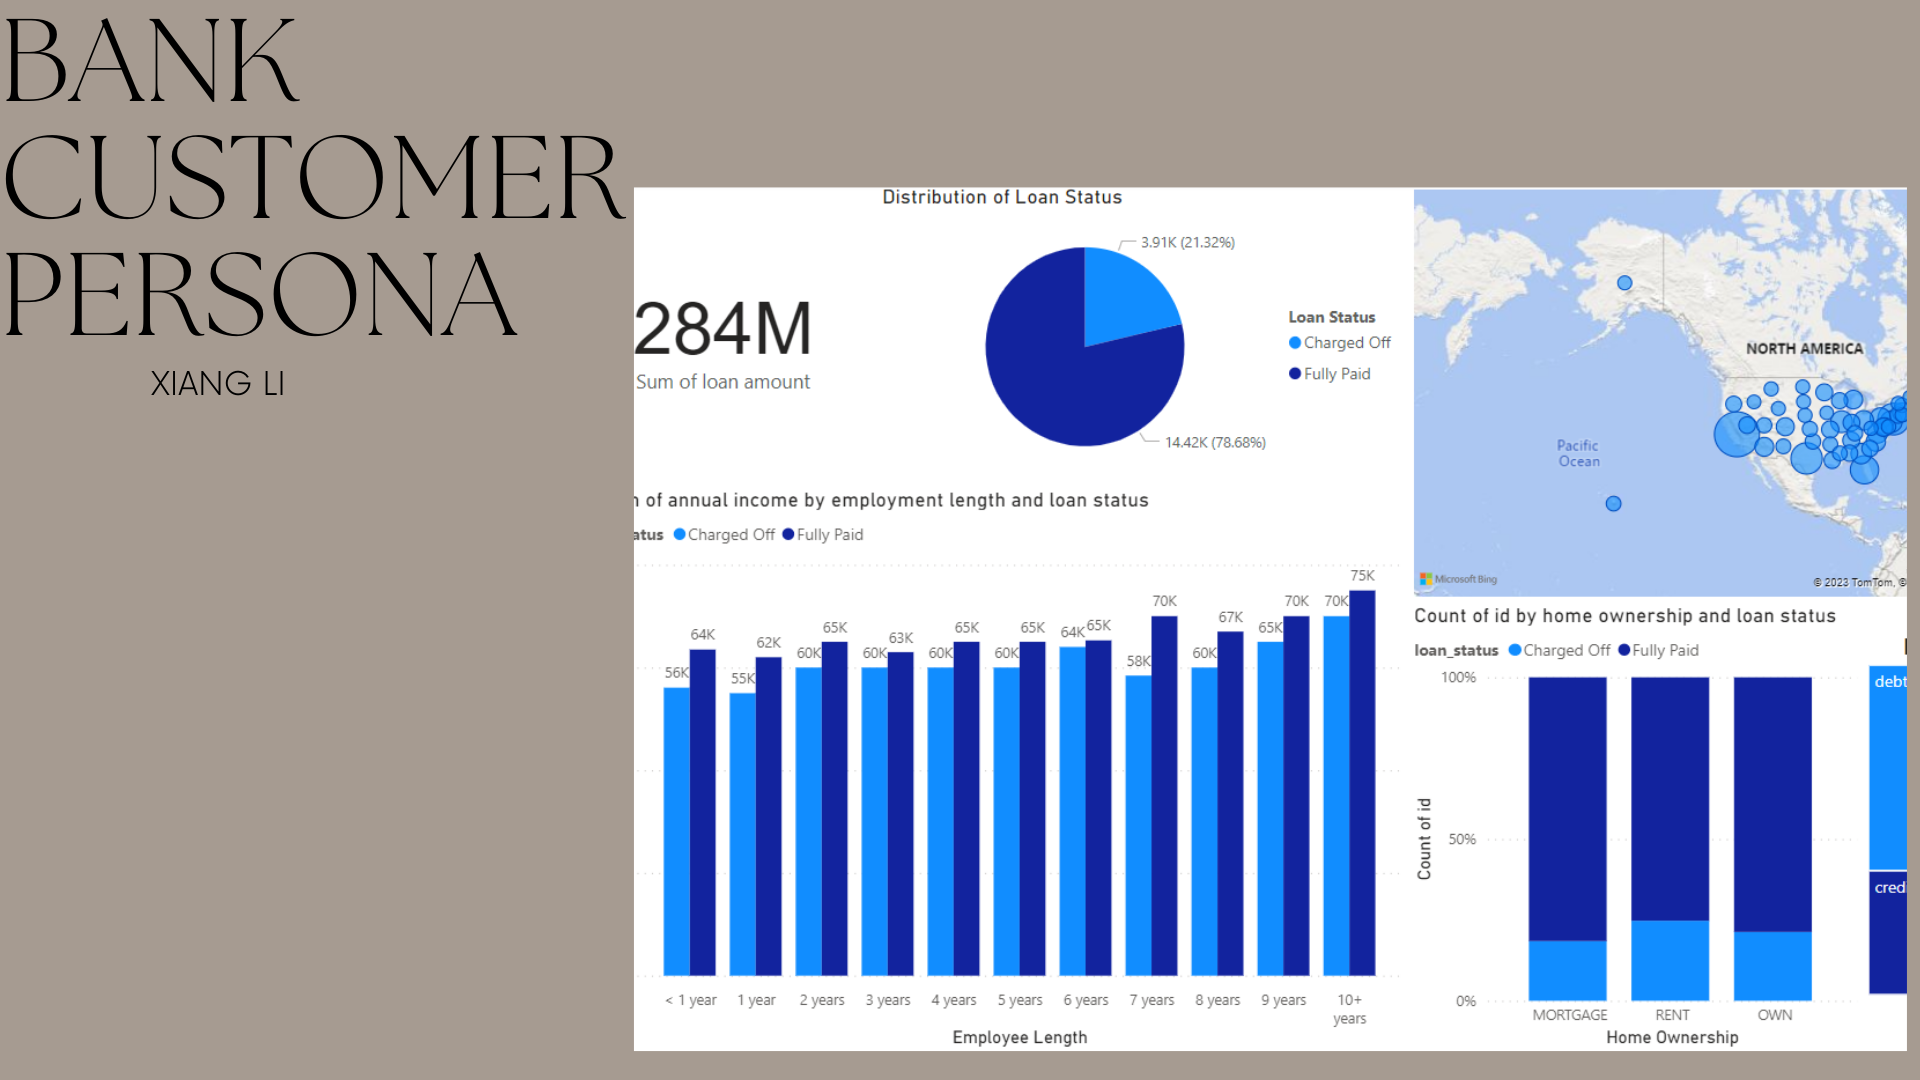
Lloyds Bank Customer Profiling
I used Power BI to profile customers for Lloyds Bank
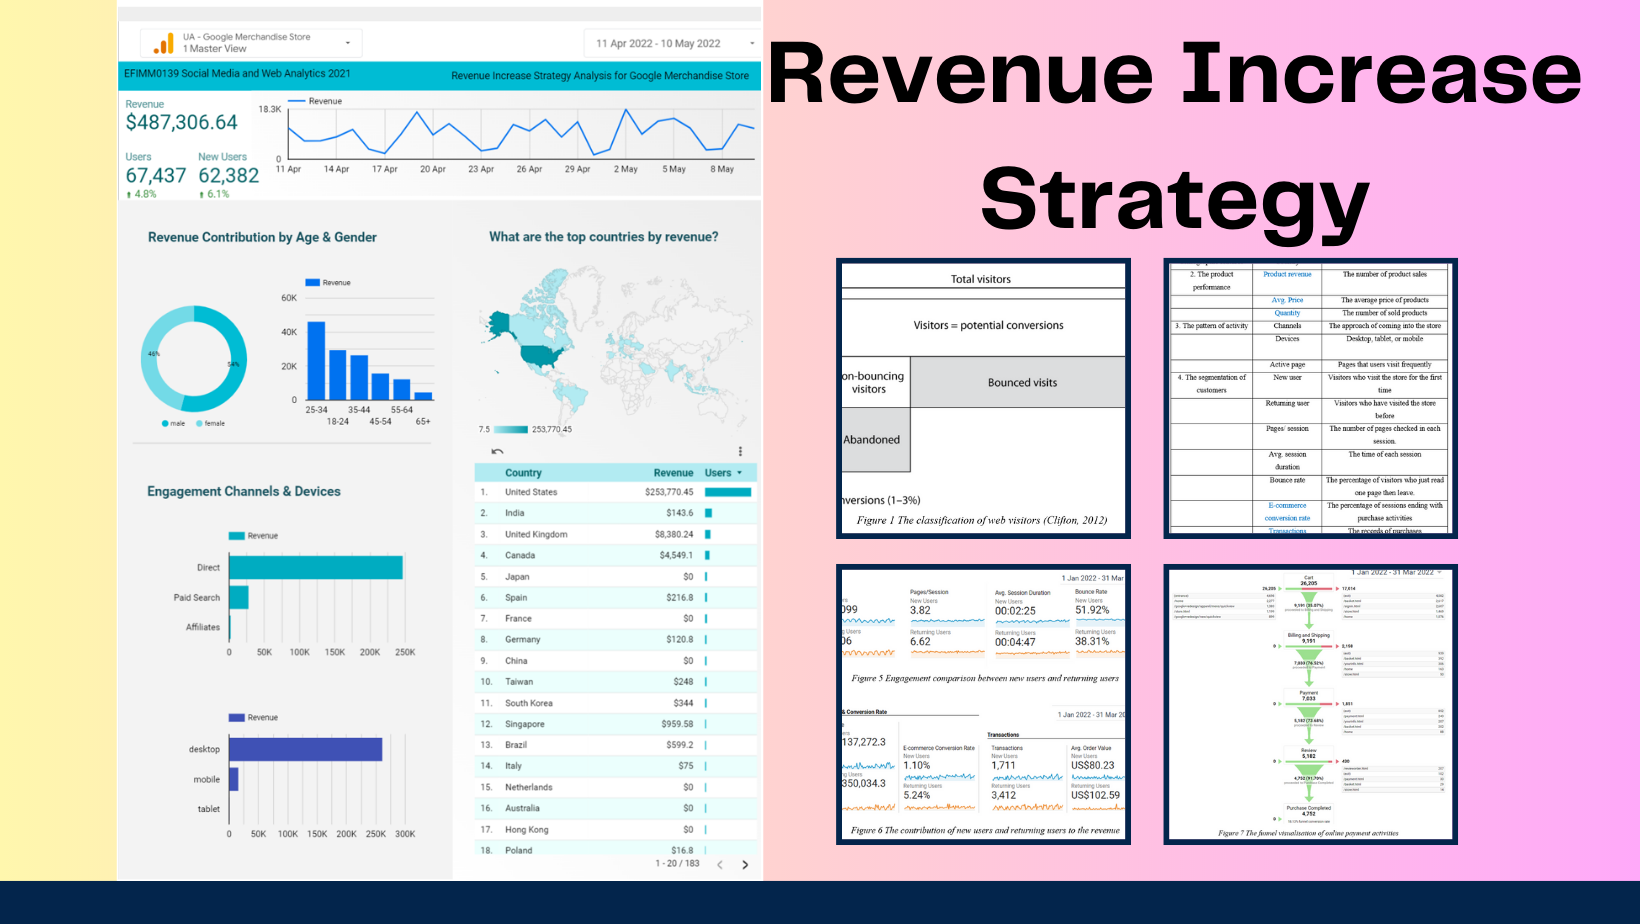
Revenue increase strategy analysis for Google merchandise store
I used Google Analytics and Looker studio to segement customers and analyse customer behaviour