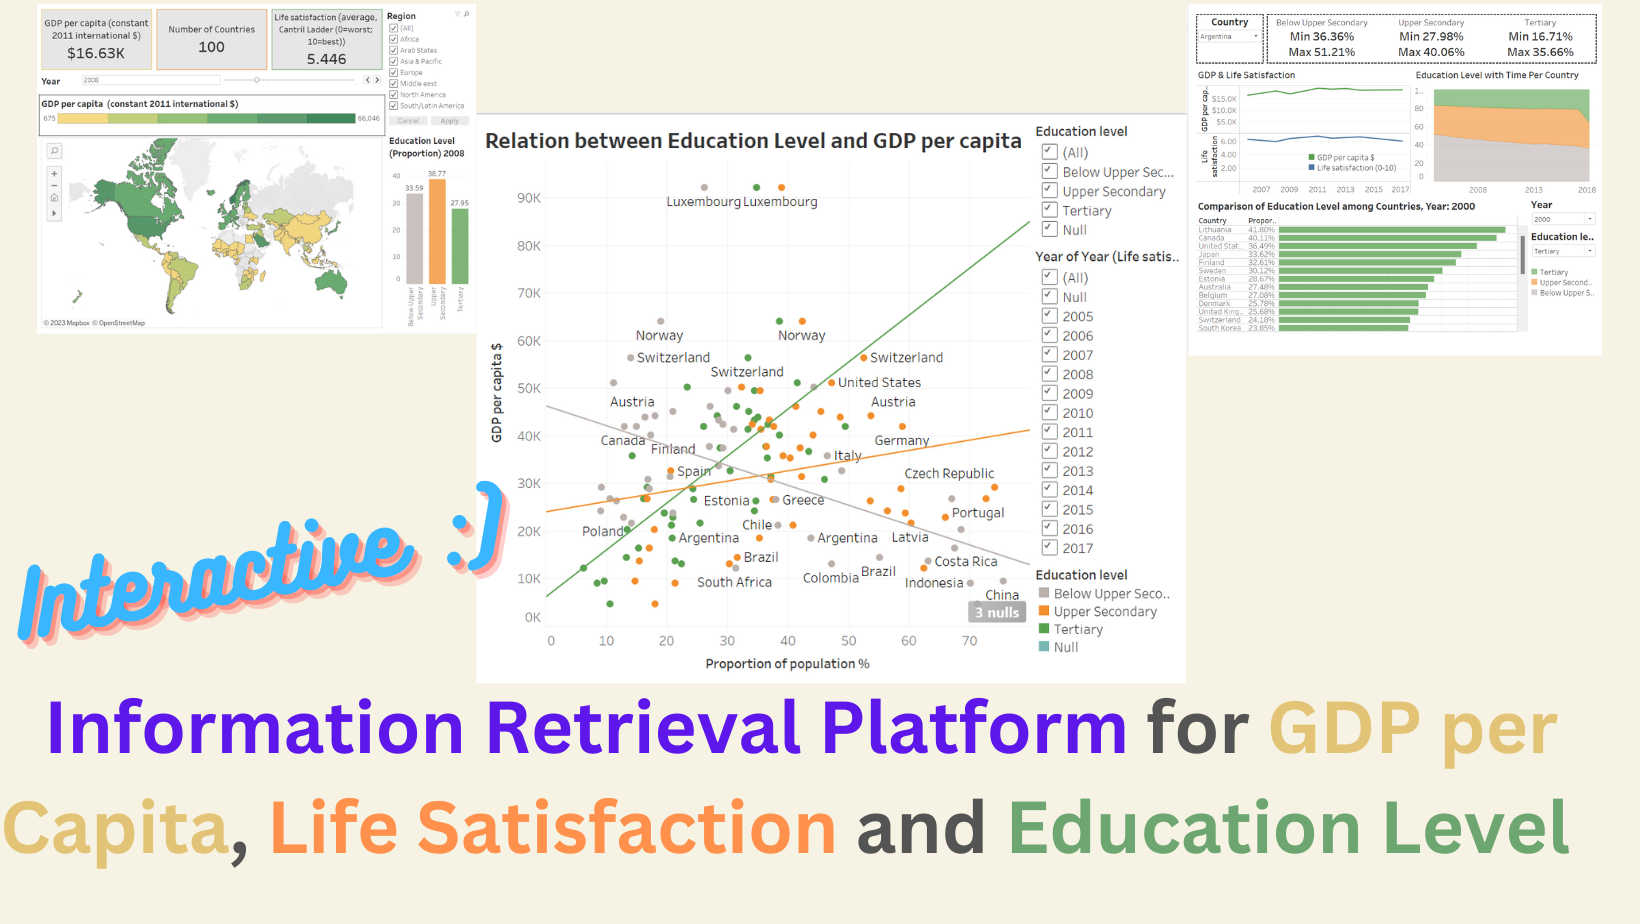
A self-service platform for GDP, Life Satisfaction and Education Level
Question: when the company gives you a dataset to build a dashboard before the interview, what should you do?
Step1. Check the datasets, and understand the meaning of each column.
I received two tables
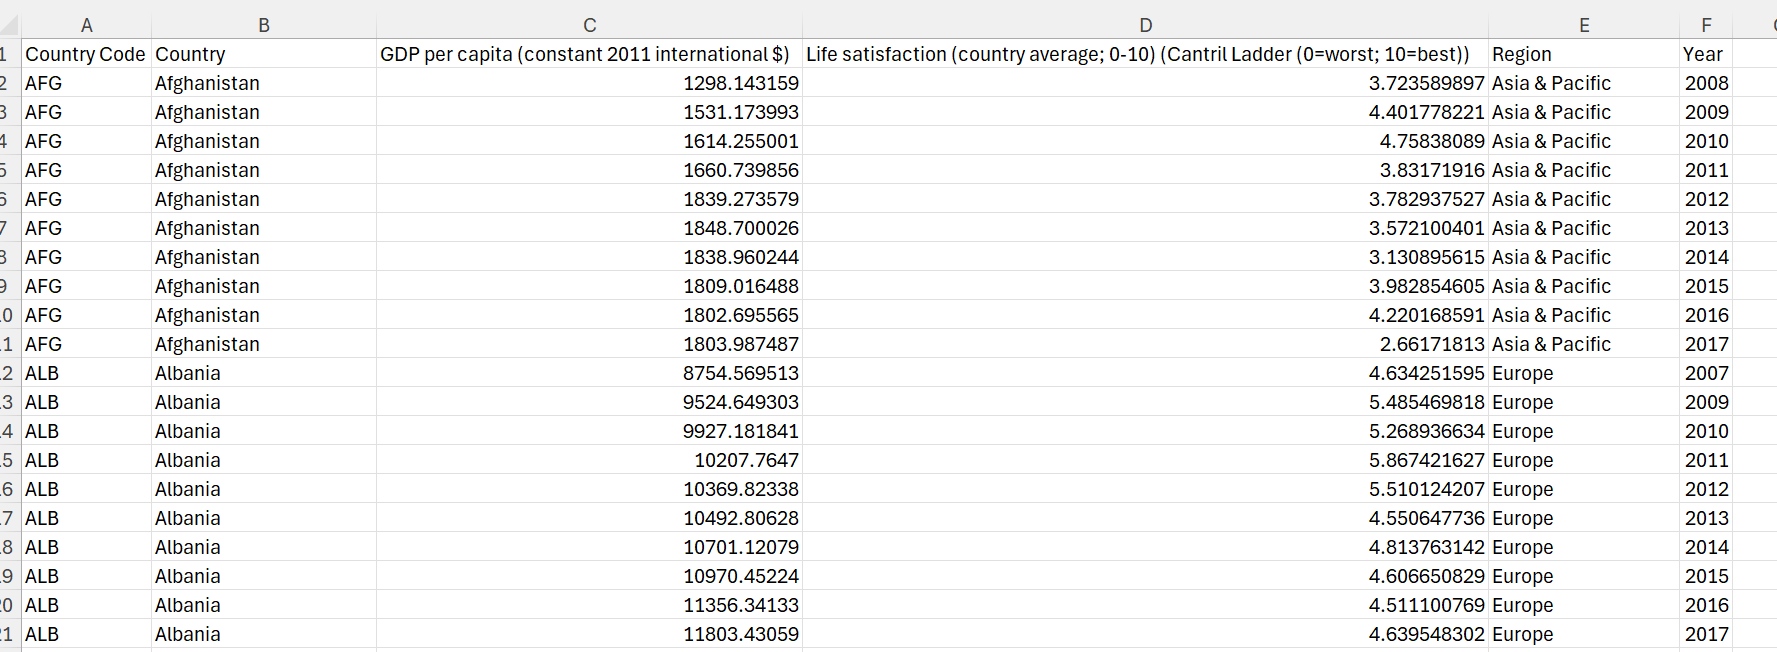
Table 1. Copy of Life Satisfaction VS GDP Extract.csv
Columns: Country Code, Country, GDP per capita, Life satisfaction, Region, Year
Use a pivot table to check the range:
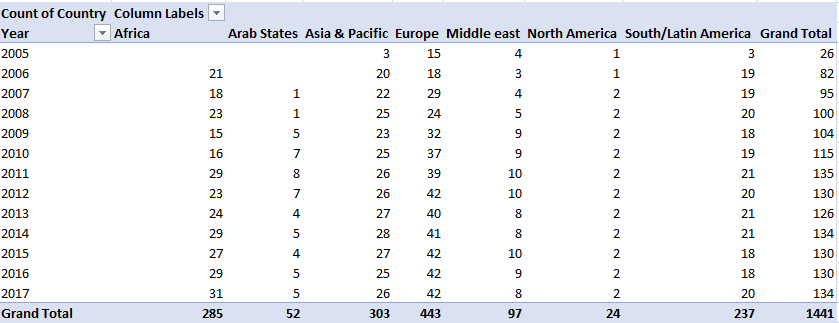
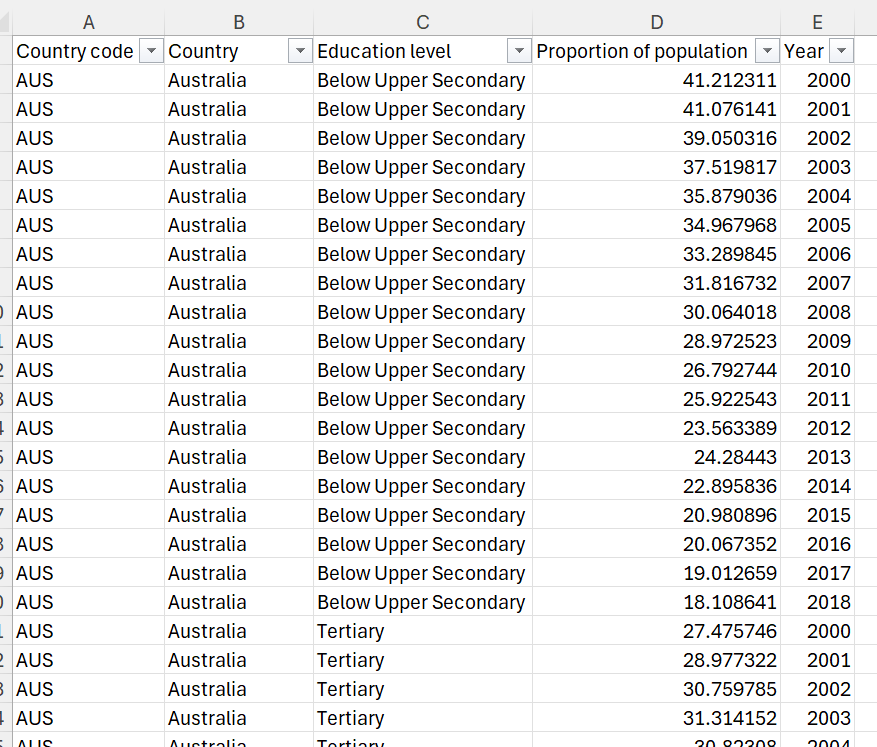
Table 2. Copy of Adult Education Extract.csv
Columns: Country code, Country, Education level, Proportion of population, Year
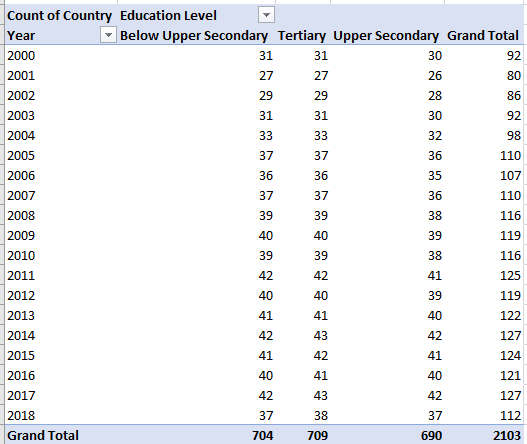
Use a pivot table to check the range:
So I have concluded that the datasets have
4 dimensions that I can use: Year, Region, Country, Education Level
3 measures that I can compare: GDP per capita, Life satisfaction, and Proportion of education level
Step 2: Identify my objects
Show trends for each country
Correlations among GDP per capita, Life satisfaction, and Proportion of education level
Step 3: Design the dashboards
3 Dashboards for 3 purposes
From GDP to see Life satisfaction and education level
From education level to see GDP and Life Satisfaction
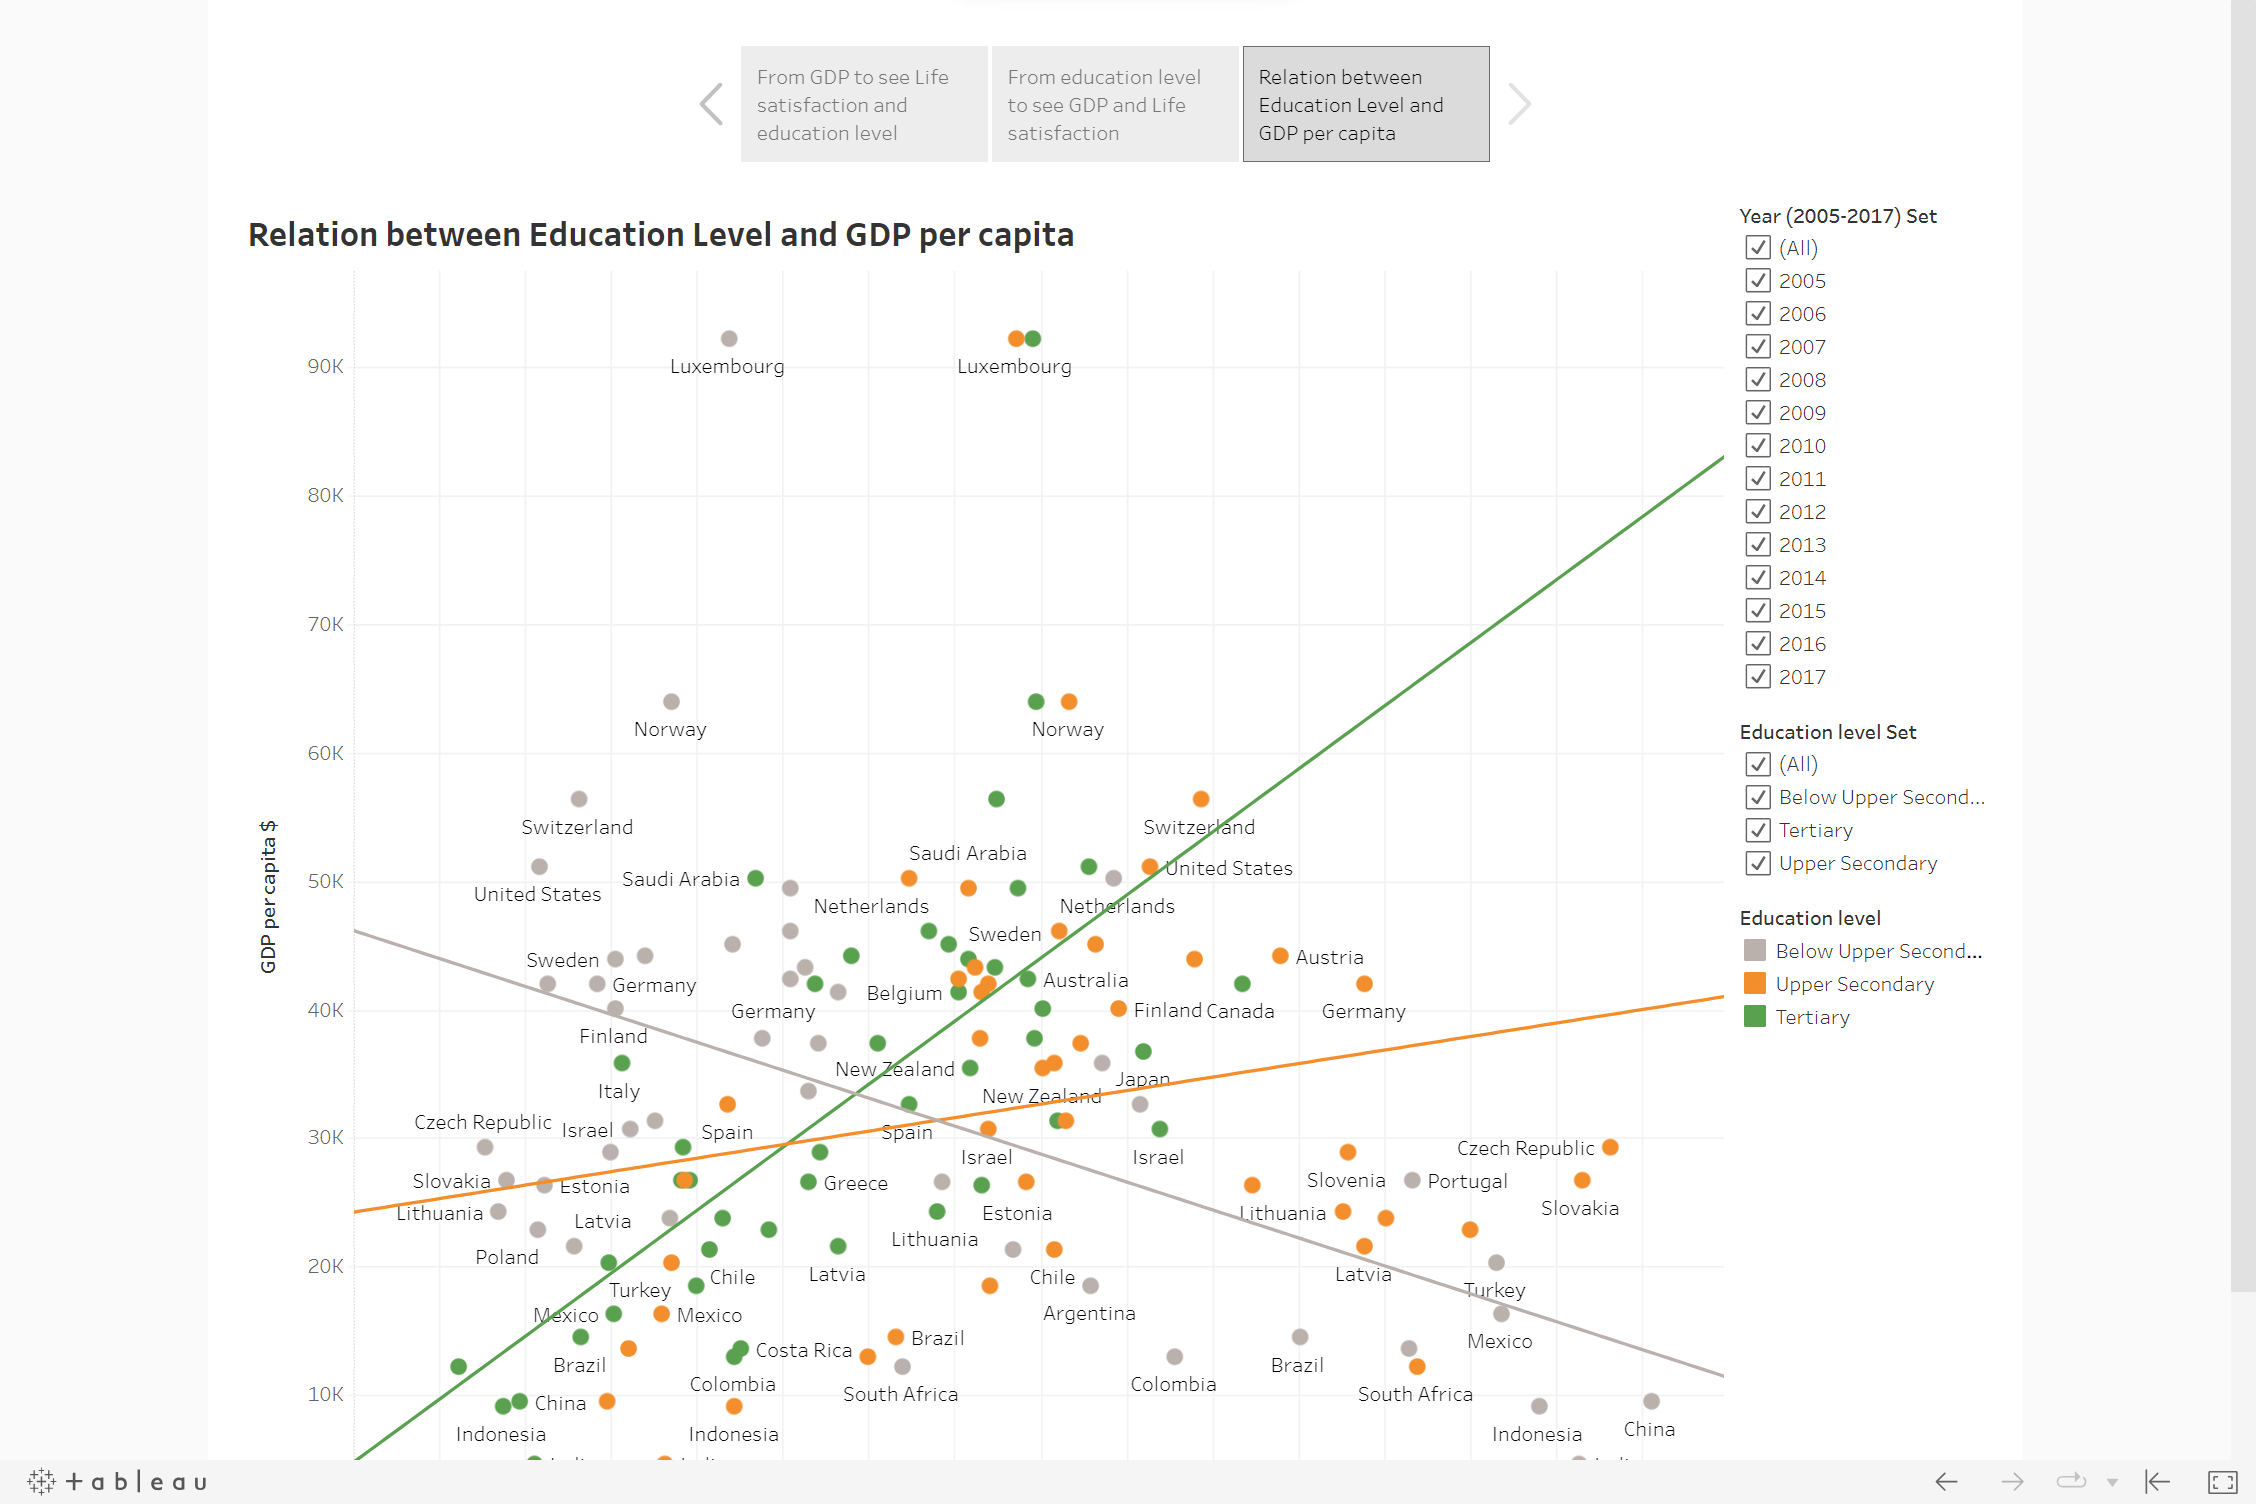
Relation Between Education Level and GDP per capita
Step 4: Data Validation and Data Cleansing
Fortunately, two tables have no missing values and they can be directly imported into Tableau.
Step 5: Build the dashboard
The finished dashboard has been published: https://public.tableau.com/app/profile/xiang.li5182/viz/PersonalProjectsIvyLi/KeyEducation?publish=yes
User Stories
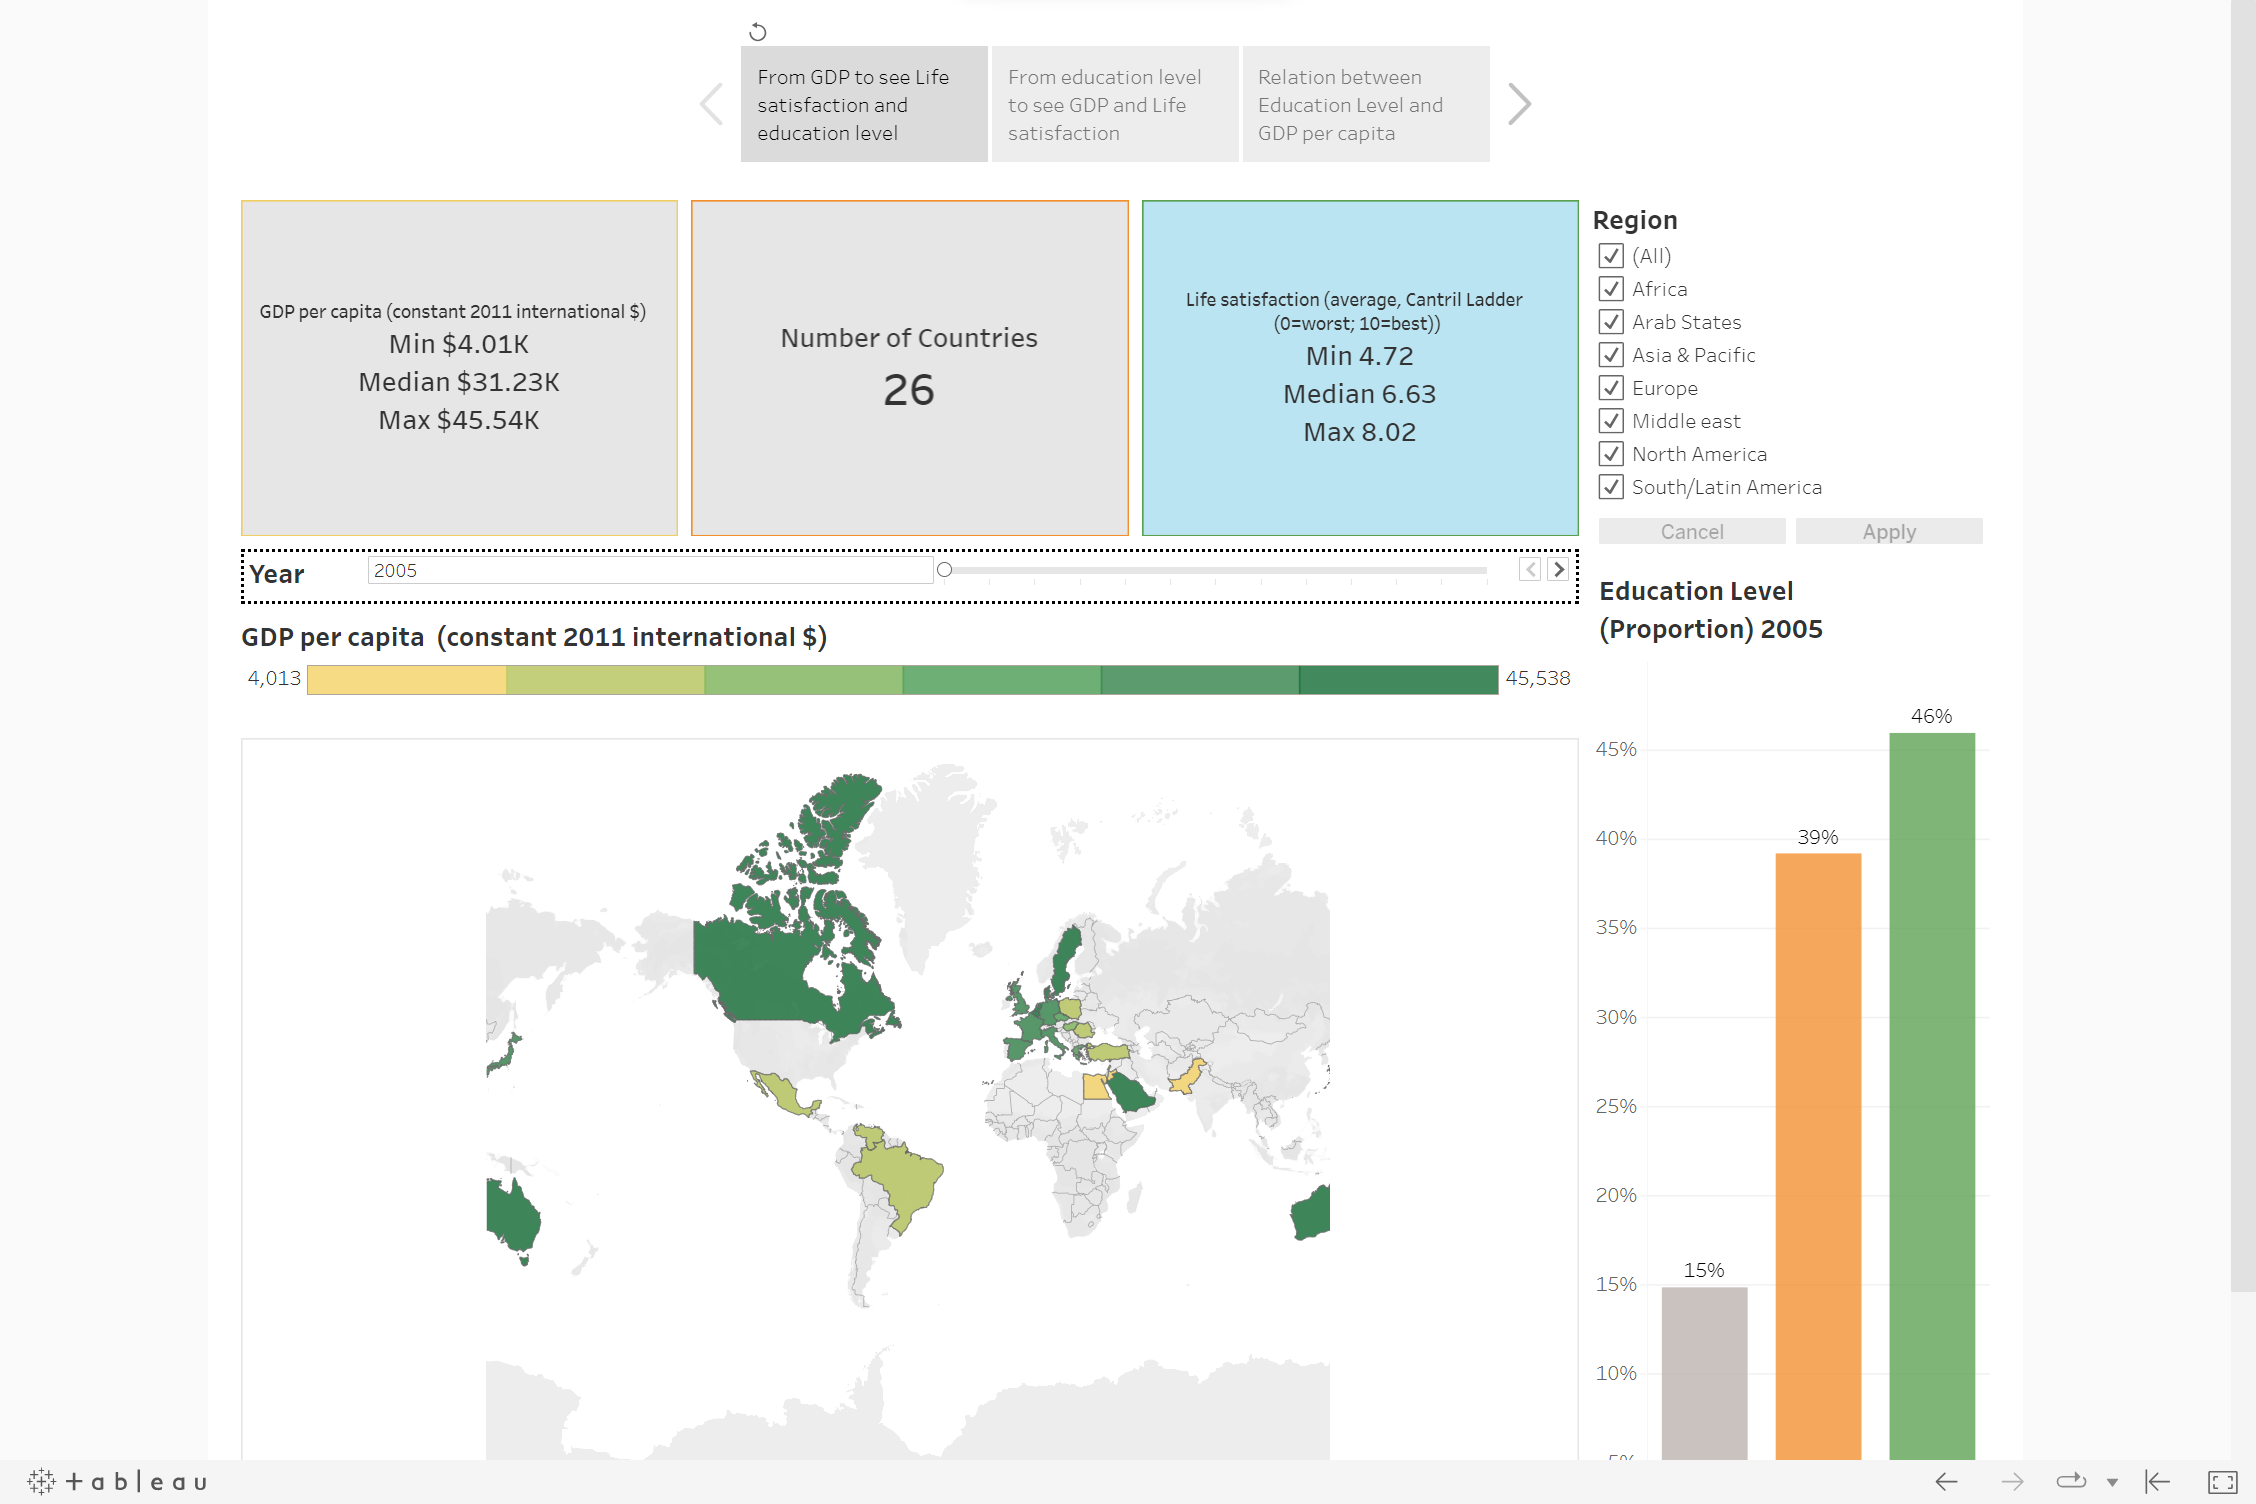
Dashboard 1 From GDP to see Life satisfaction and education level
Action1: select different regions to check the minimum, median and maximum GDP values, Life Satisfaction and the average Education Level
Action 2: Choose which year users are interested in
Action 3: Choose a country on the map and see GDP, Life Satisfaction and Education Level (tooltips also show the same information)
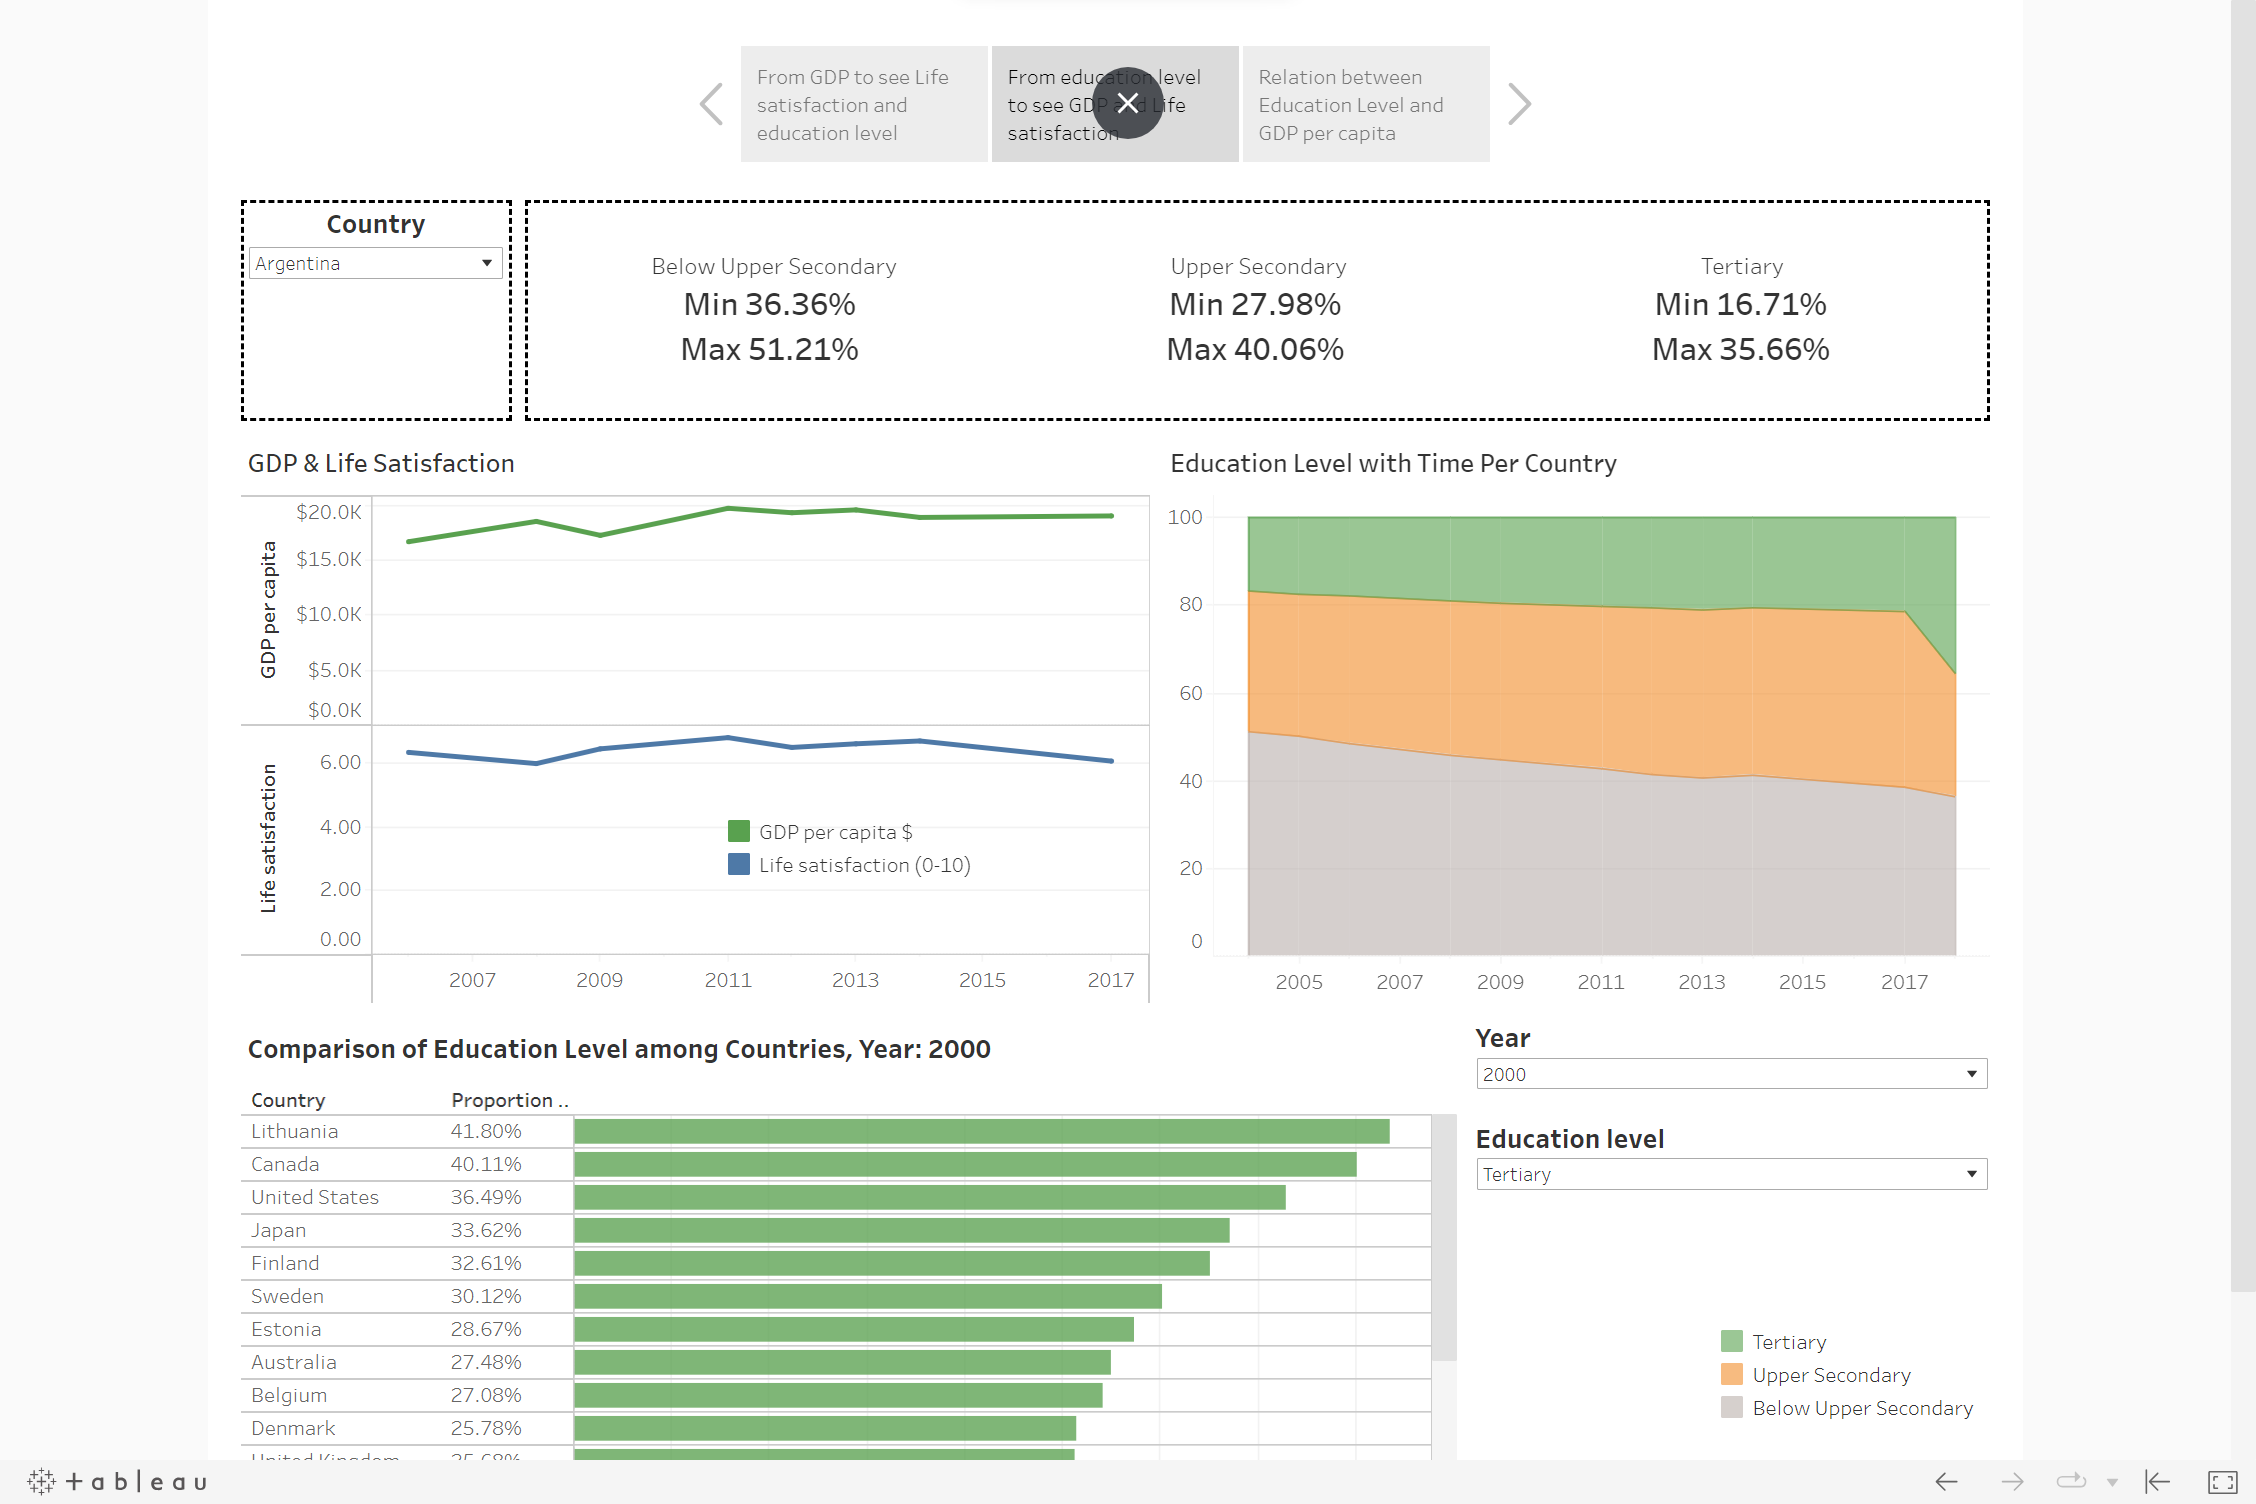
Dashboard 2: From Education Level to see GDP and Life Satisfaction
Action 1: Choose one country to check the trend of GDP per capita, Life Satisfaction and Education Level
Action 2: Choose the year and Education Level to check which country has a higher value in Education Level
Dashboard 3: Relation between Education Level and GDP per capita
- Action: Choose which year users want to compare GDP and Education Level among countries to understand if Education Level correlates with GDP