BT Customer Churn Influencer
Table of Contents
Chapter 1 - Project Overview
Chapter 2 - Data Visualisation
Chapter 3 - Data Validation
Chapter 4 - Logistic Regression
Chapter 5 - Feature Importance
Chapter 6 - Recommendation
Chapter 1 Project Overview
The event is that Dig Data cooperated with BT Group to provide an opportunity to experience the "real world" business problem. Logistic regression is popular in the business environment as there are many binary values (spam email or not, cancel the contract or not, promotion or not and so on).
In this project, I am going to use a logistic regression model to predict customer churn and identify the key features.
Meanwhile, I will also use Power BI to give the audience some general ideas about key influencers.
You can find the Jupyter Notebook on my GitHub.
You can also find the Published report on my novyPro portfolio.
Background Information
BT Group is investigating why some customers stop using BT services (churn), including:
Build a model that predicts which customers are highly likely to leave
Interpret the model to understand what influences the customers' decision to leave
Make recommendations to the business:
How to engage the customers to stay with BT?
How to retain more customers?
Chapter 2 Data Visualisation
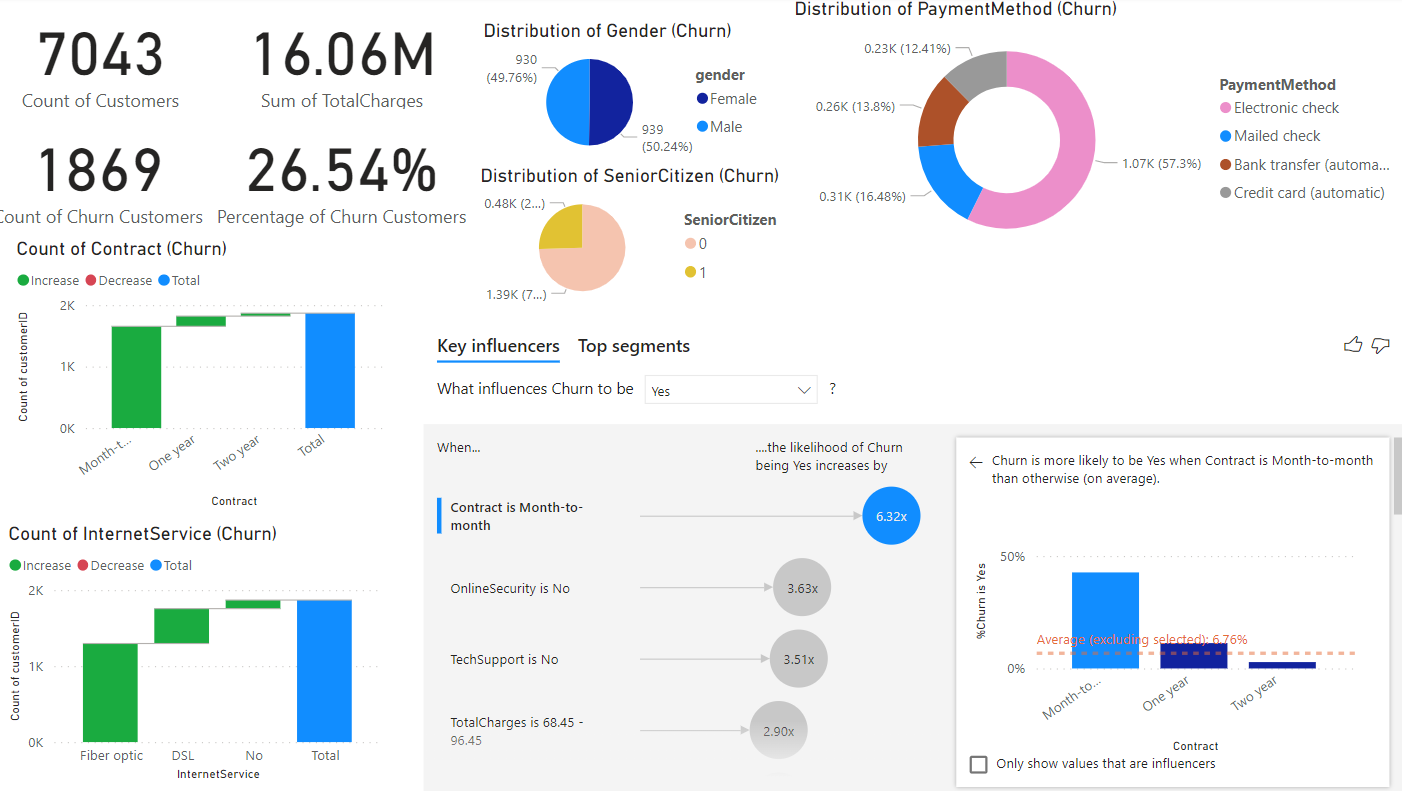
Firstly, I used Power BI to do the initial exploration. You can see we have 7,043 customers, generating 16.06 M in revenue. Then 1,869 customers chose to leave, accounting for 26.54% of the total customers.
There are several points we can get:
There is no difference between genders
The majority of churn customers are a non-senior citizen
Electronic check is the most popular payment method
The month-to-month contract is the type of contract that most churn customers signed
Fibre optic internet service is the most popular among churn customers
Key influencers visual calculates that the likelihood of churn for the contract is month-to-month increased 6.32 times
Chapter 3 Data Validation
BT provided 7,043 rows (customers) and 21 columns (features). The "Churn" column is the target, showing whether the customer left the company (Churn = 'Yes') or not (Churn = 'No').
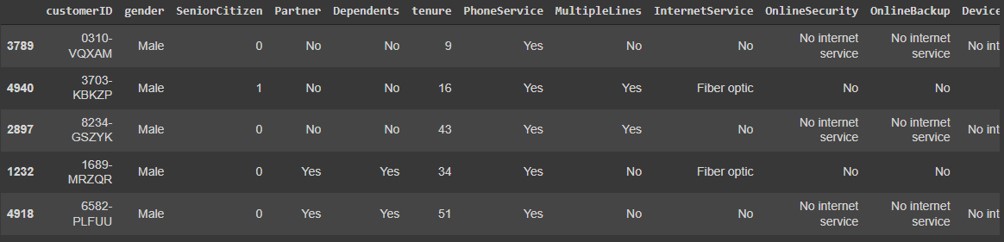
The dataset includes information about:
Customers who left within the last month - the column is called Churn
Services that each customer has signed up for - phone, multiple lines, internet, online security, online backup, device protection, tech support, and streaming TV and movies
Customer account information - how long they've been a customer, contract, payment method, paperless billing, monthly charges, and total charges
Demographic info about customers - gender, if they have partners and dependents
You can find the dataset and dictionary on my GitHub.
Steps to adjust the dataset:
delete customerID, the feature is unuseful
delete null values, TotalCharges column has missing values
adjust datatype, TotalCharges should be numeric rather than object
merge some categories, InternetService has 'No' and 'No internet service', they should be merged together, others do the same
Steps to adjust the dataset for preparing the model:
convert 'yes' to 1, 'no' to 0
convert 'Female' to 1, 'male' to 0
generate dummy variables for categorical features ('InternetService', 'Contract', 'PaymentMethod')
scaling continuous values to avoid bias ('tenure', 'MonthlyCharges', 'TotalCharges')
After the data validation and preparation, the dataset contains 7,032 rows and 27 columns without missing data.
Chapter 4 Logistic Regression
Step 1 split data: split the dataset into a training dataset and a test dataset, I use an 8:2 ratio to split it.
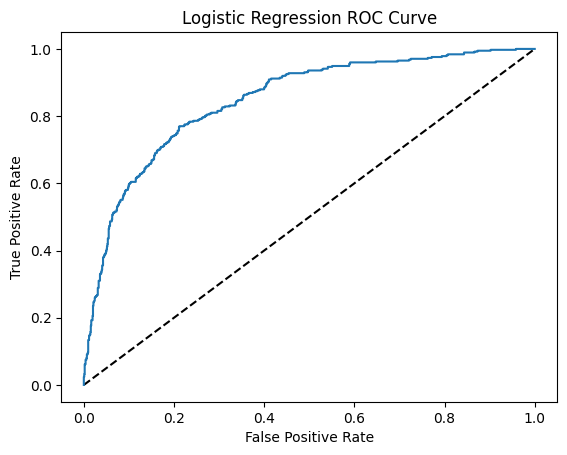
Step 2 modelling: define a function which generates the model and calculates confusion matrix, accuracy, f1-score, coefficients and corresponding probability.
The result is AUC=0.85
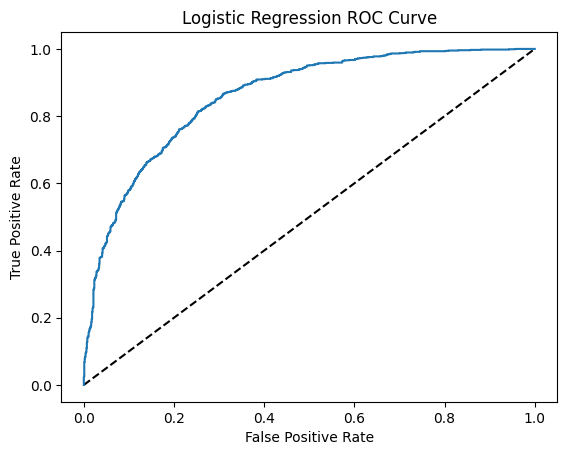
SMOTE Optimisation
As the number of 0 values is much less than 1 value in our dataset (imbalanced), the accuracy is not able to reflect if the model is good. Therefore, I used Synthetic Minority Over-sampling Technique (SMOTE) to oversample the 0 value to make the number of 0 value equal to another one.
The optimised result is AUC=0.86
Chapter 4 Feature Importance
The purpose of this project is to identify key features, I extracted coefficients for each feature and mapped them in a bar plot.
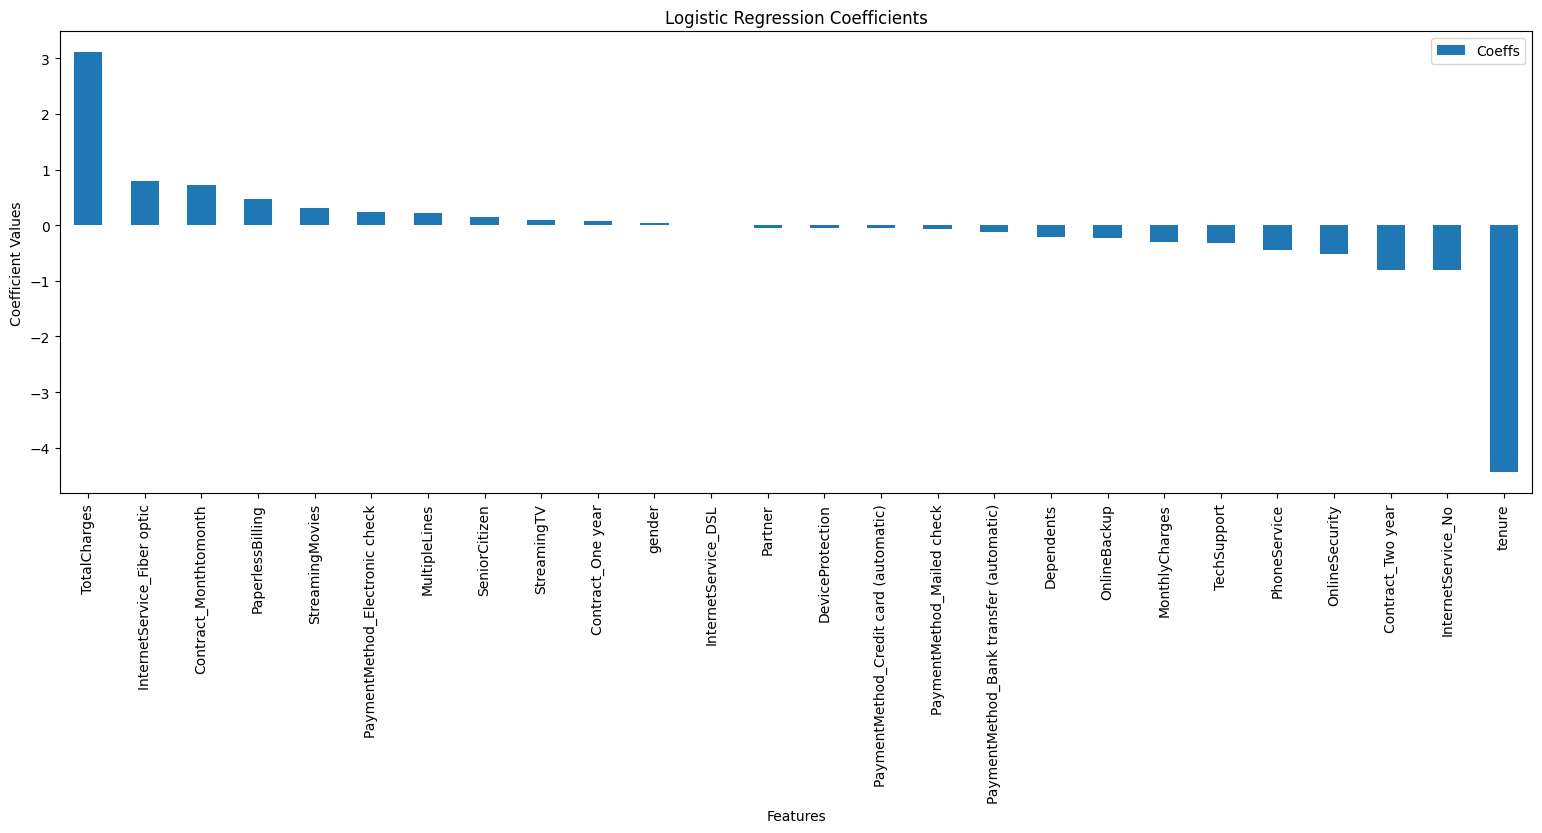
From the bar plot, it is easy to say that tenure has a negative relationship with churn, which means if customers sign contracts longer, they are less likely to leave BT service. Meanwhile, the total charge pushes customers to leave. Other features also play a role in churn, like customers who are loyal prefer no internet service and a two-year contract rather than a monthly contract.
Chapter 5 Recommendation
For the marketing team, I have several pieces of advice:
Provide a bonus for a longer contract
Add online security and phone service for each customer
Enhance tech support service
Furthermore, the current status of "0" (not churn) does not mean they will stay with BT forever
- Use the model to analyse customers who may leave (high probability), then connect these customers for feedback
My Certificate