Education-Focused Analysis: How Assessment Types Shape the Final Result
I used Power BI to explore the reasons why changing the mix and weighting of assessment types in presentation 2014J compared with other presentations of module BBB appeared to be associated with a change in final results. The task shows my Exploratory Data Analysis (EDA), Data Engineering, Data Visualisation, and Story Telling skills.
The published report: https://www.novypro.com/project/education-focused-analysis-how-assessment-types-shape-the-final-result
Data and Relevant Files are here: https://github.com/xiangivyli/data-science-portfolio/tree/main/part_c_education_focused_analysis_report
Context:
The Open University has launched a series of modules (courses) and collected user interaction data over two years. The academic module leader would like to discuss with other staff teaching on the module:
- Why changing the mix and weighting of assessment types in presentation 2014J compared with other presentations of module BBB appeared to be associated with a change in final results.
Data Source
Open University Learning Analytics dataset
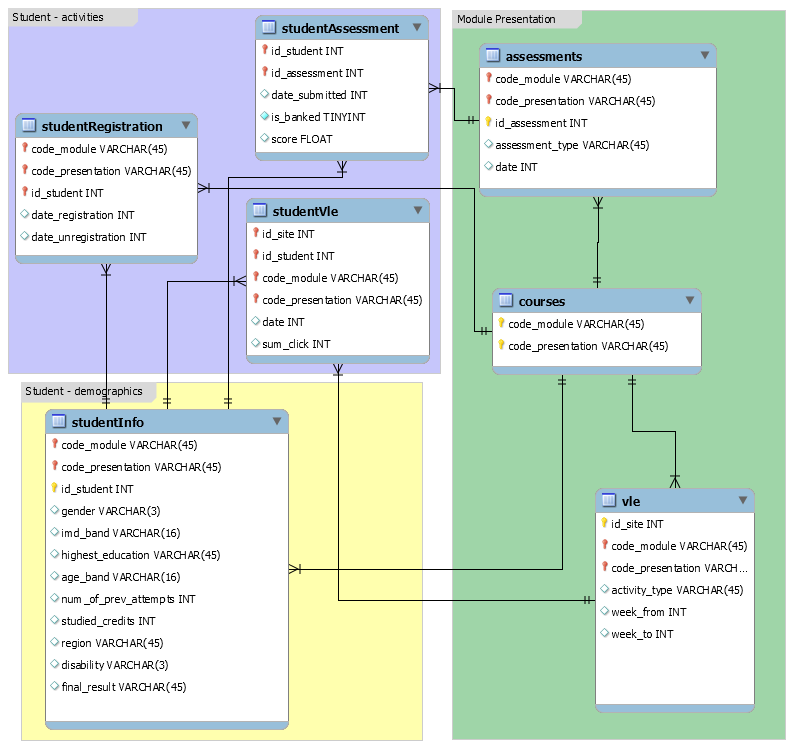
7 Tables:
courses.csv
assessments.csv
vle.csv
studentInfo.csv
studentRegistration.csv
studentAssessment.csv
studentVle.csv
Database schema
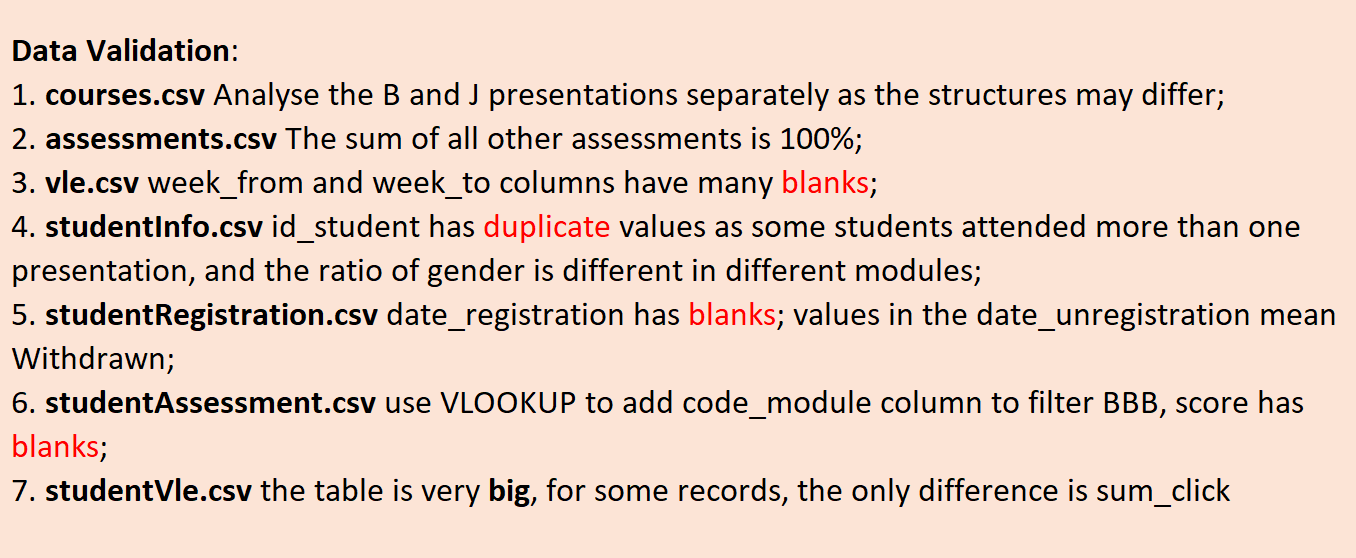
Data Validation
I summarised pivot tables to understand the categories and the range of numbers
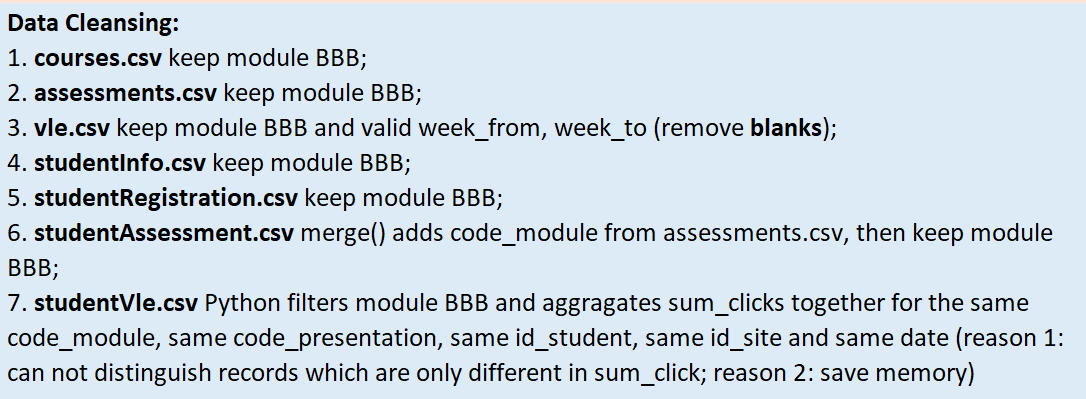
Data Cleansing
I used Python to filter data, only module BBB data was kept
The code can be found on my Github: https://github.com/xiangivyli/data-science-portfolio/tree/main/part_c_education_focused_analysis_report/OULAD_Python_Transformation
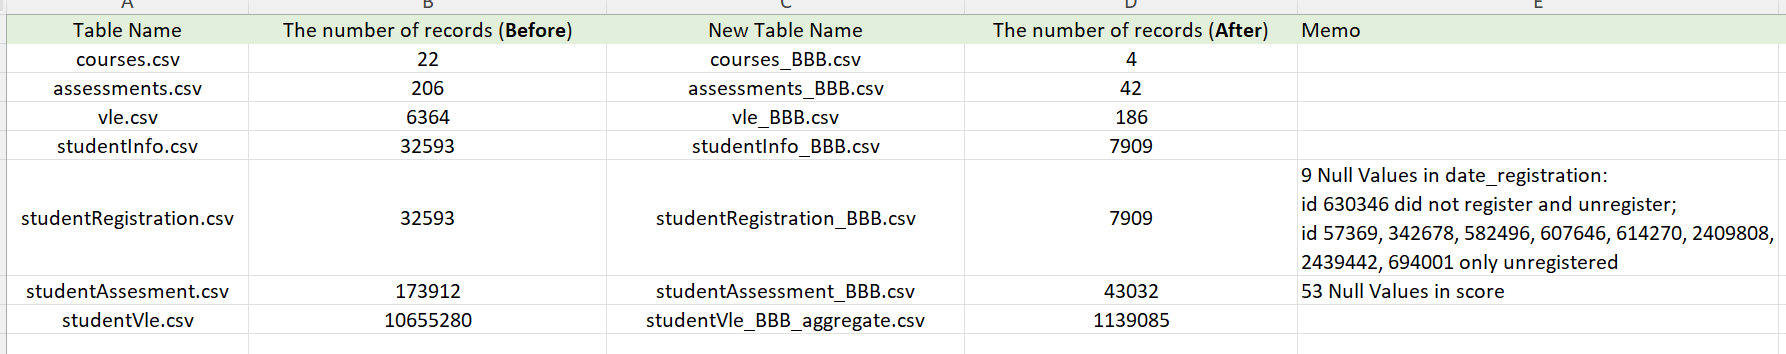
I recorded the changes of cleansed dataset for future review
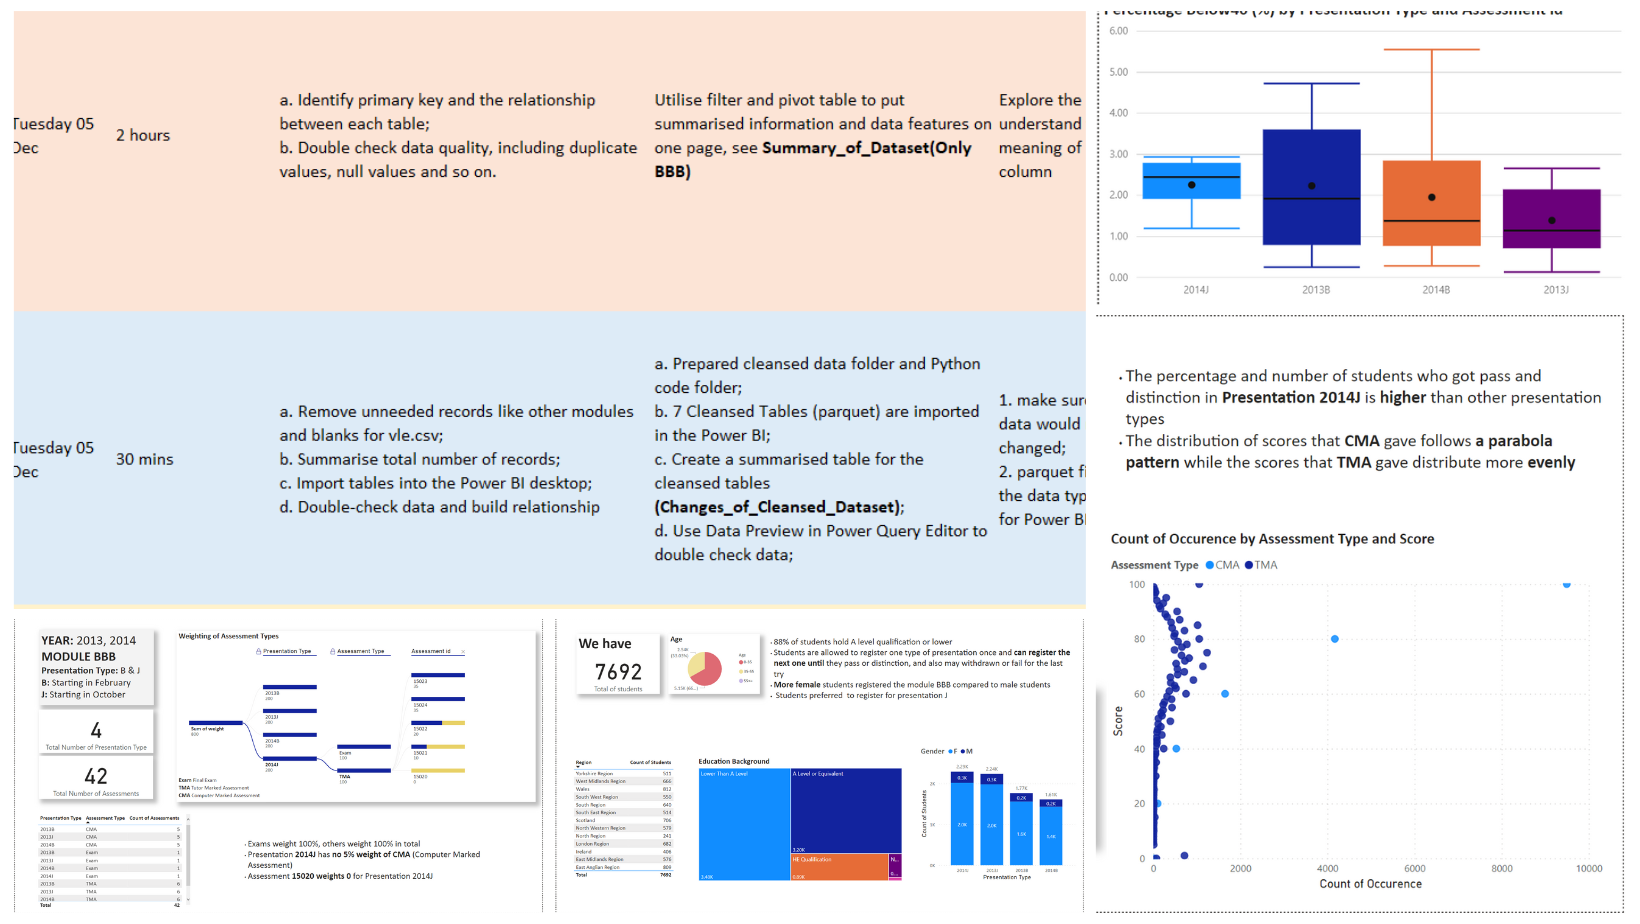
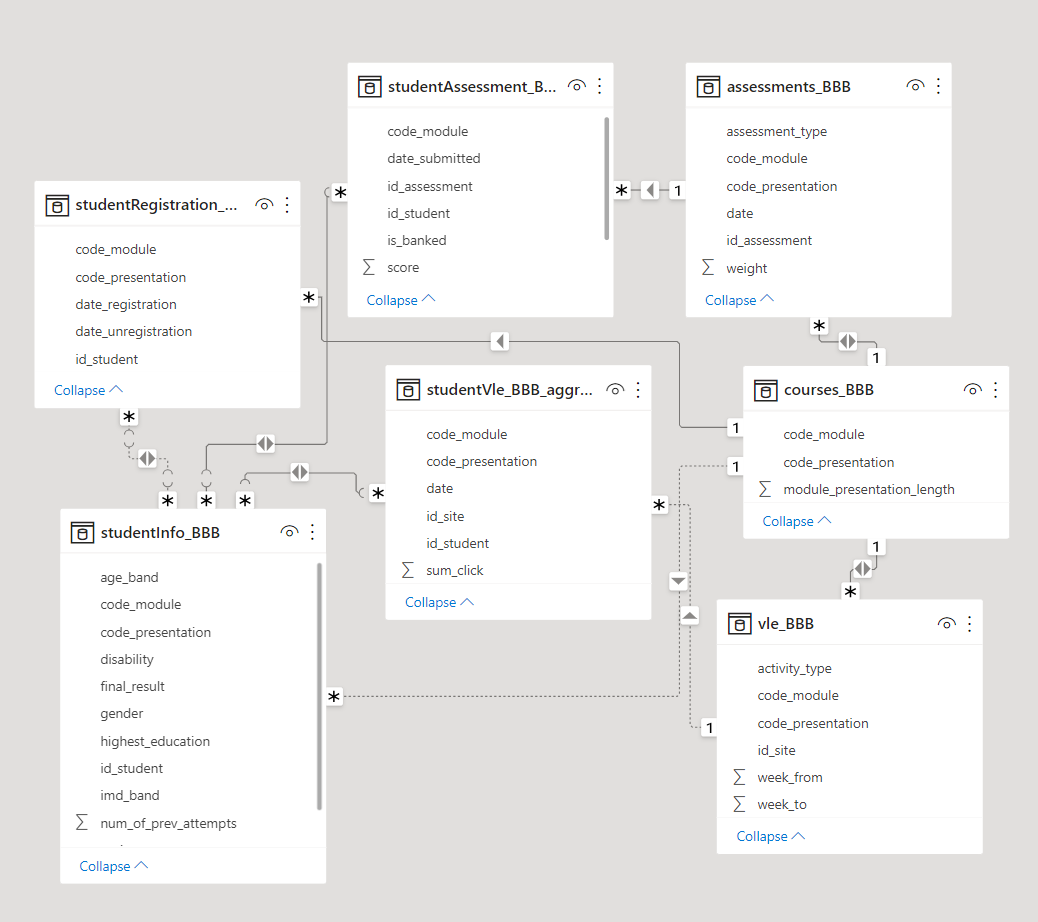
Power BI Step
Generated Parquet files were imported in the Power BI and the 7 tables were created relationship using Data Modelling
Page 1 Overview of Module BBB
The data was collected during 2013 and 2014, they have 2 presentation types B and J, B started in February, and J started in October. There are 4 Presentation Types, 2013B, 2014B, 2013J, and 2014J.
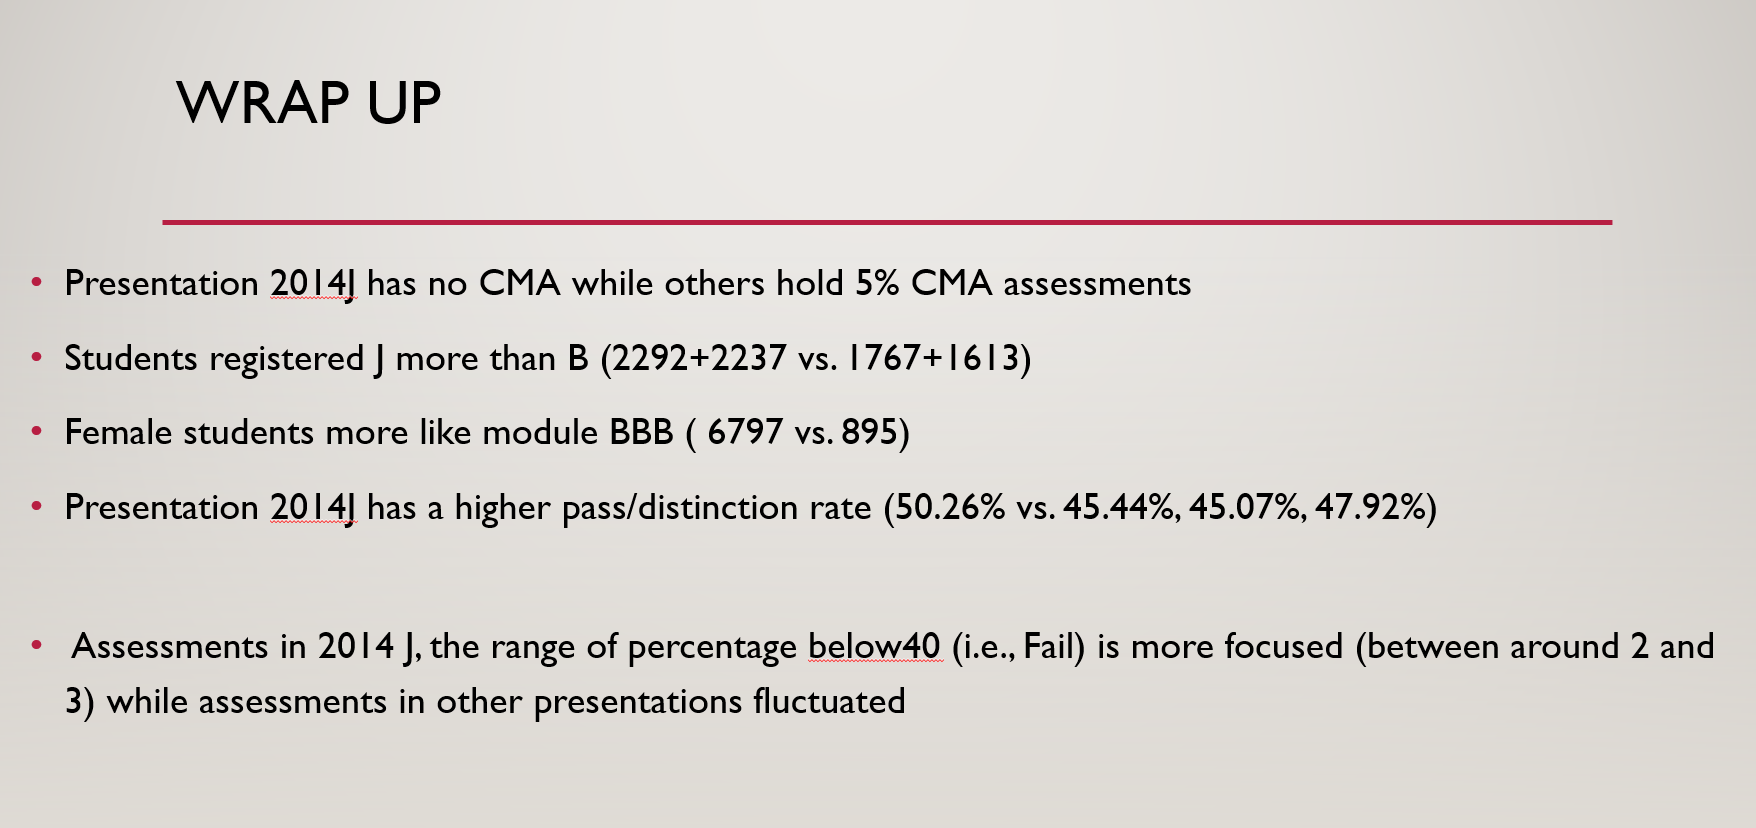
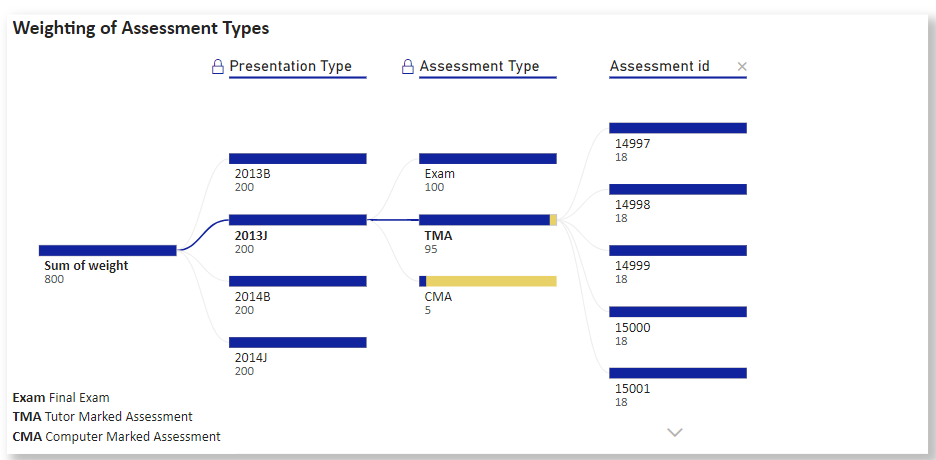
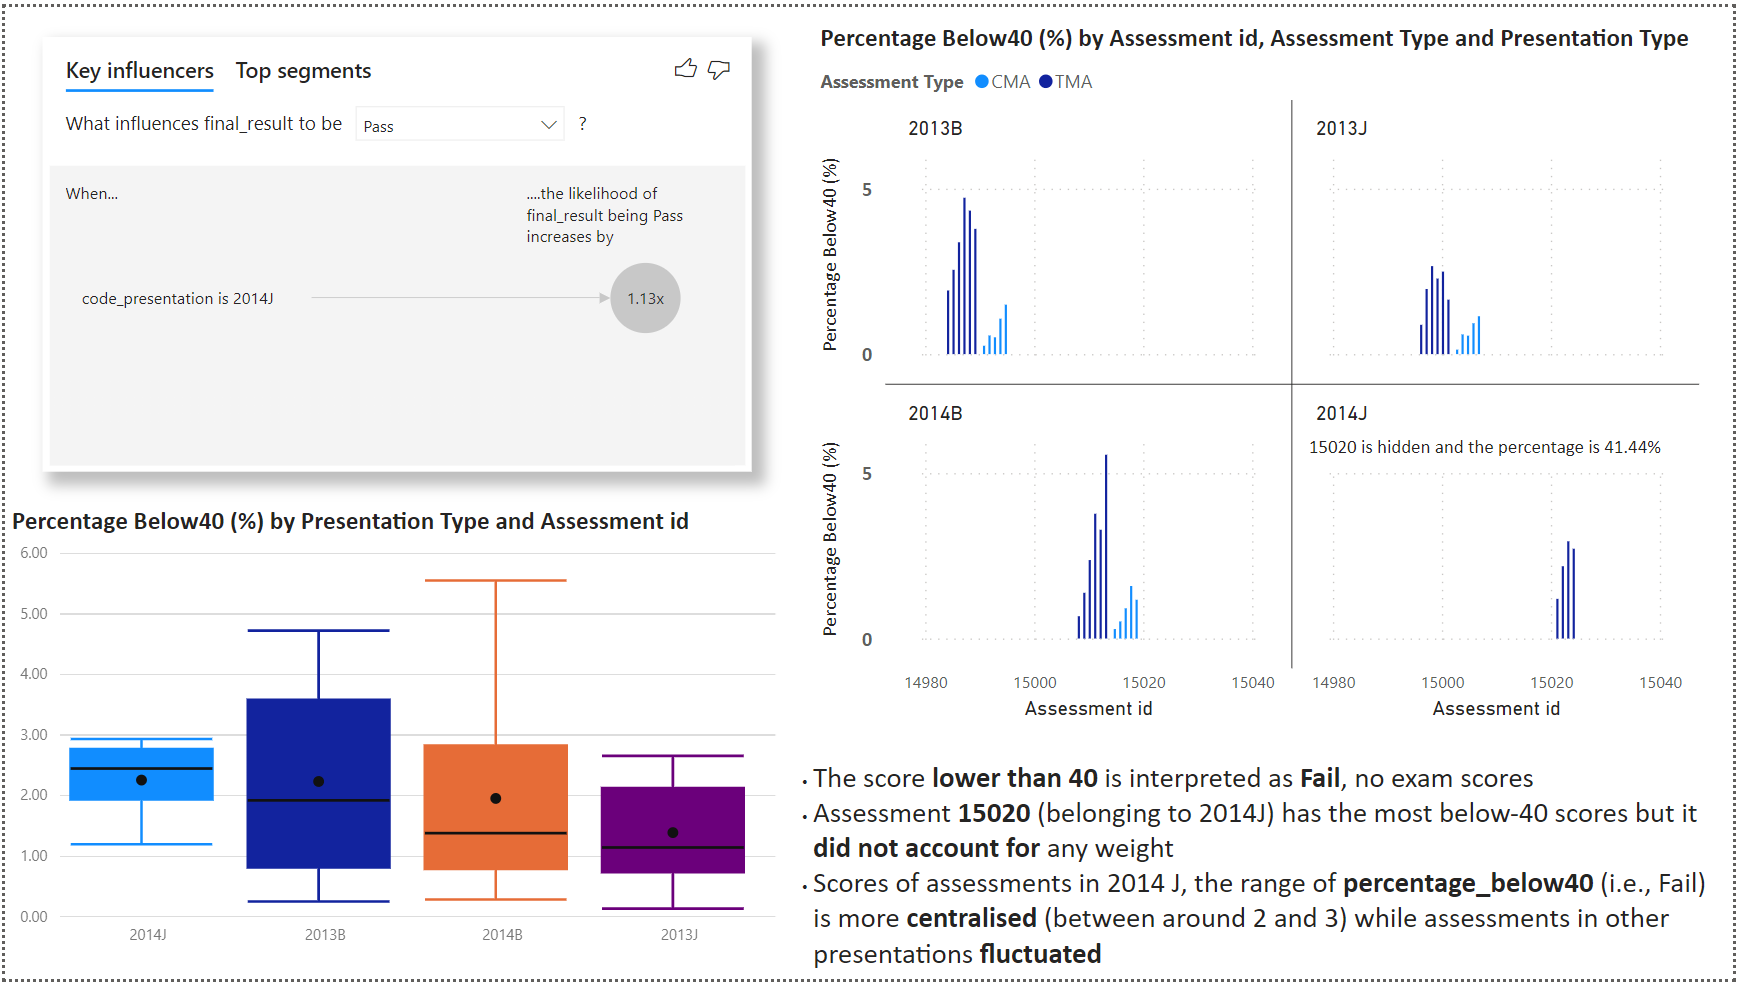
For Assessment Types, 2014J was composed of Exam and Tutor Marked Assessments, while other Presentations have Computer Marked Assessments.
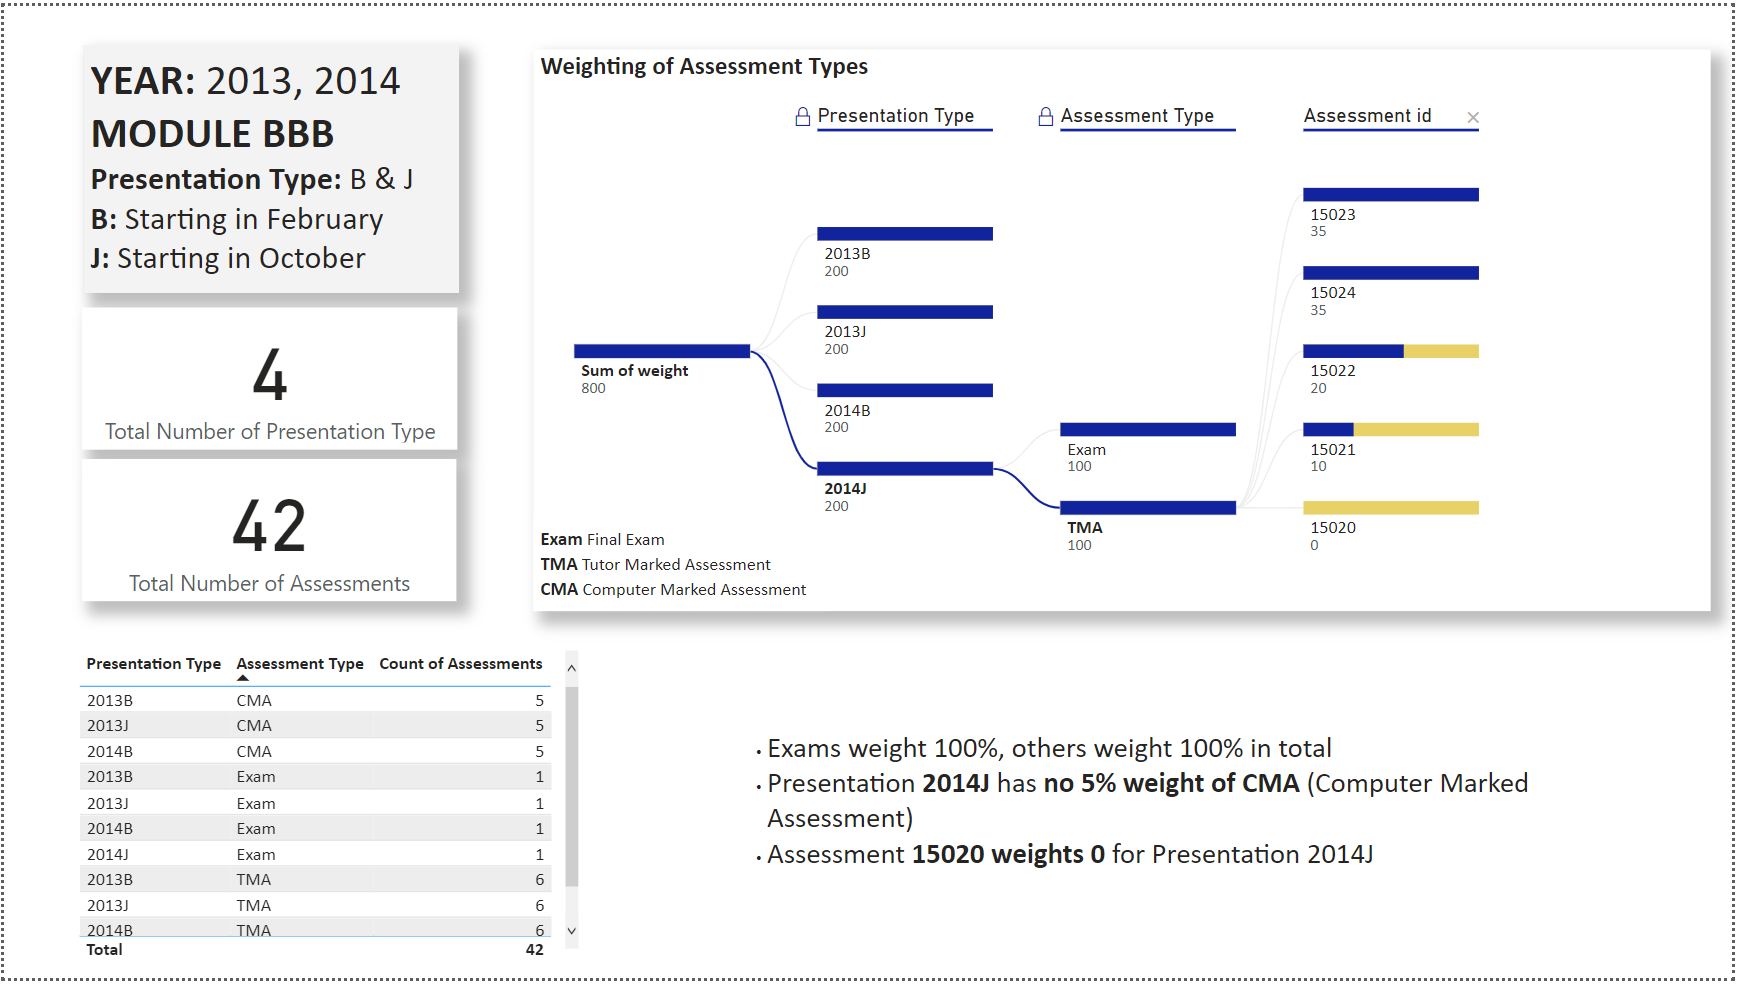
For 2014J, different assessment types have different weights, id 15023 and id 15024 weighted 35, and id 15020 weighted nothing.
For other presentations, Computer Marked Assesments counted for 5%, each assessment counted for 1%
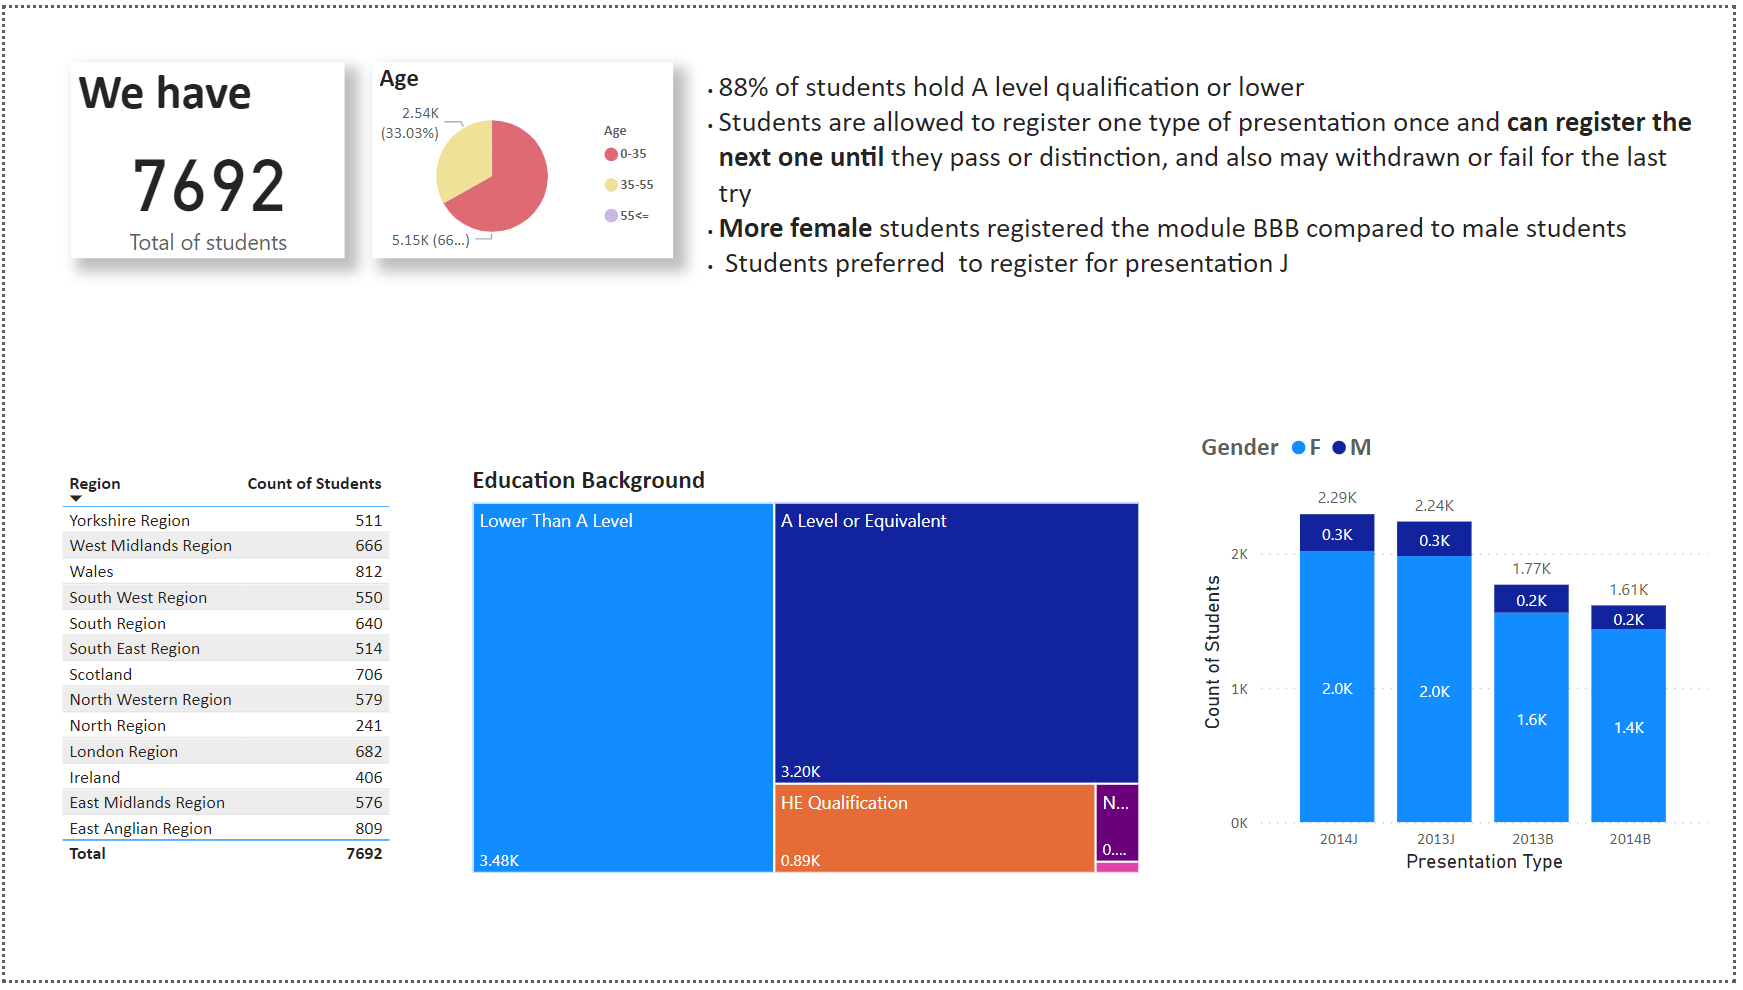
Page 2 Student Persona
The most significant feature is more female students registered for the module BBB than male students
Students preferred to register for presentation J than B.
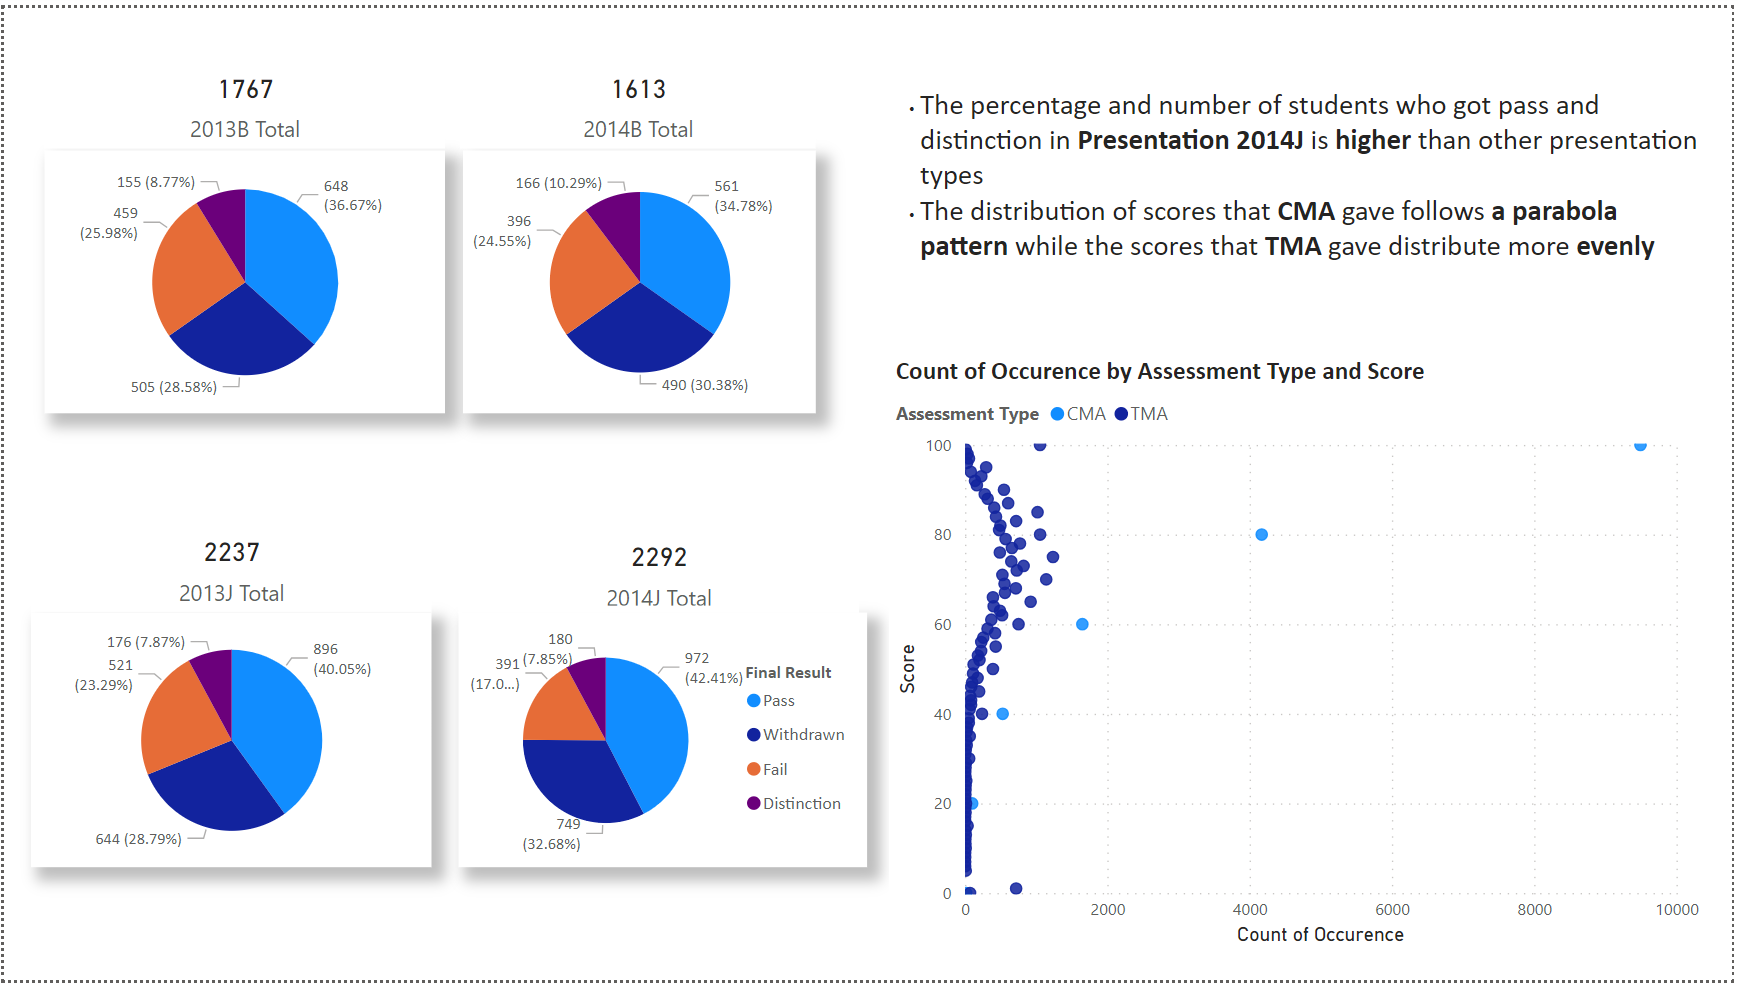
Page 3 Final Results
The Pass percentage of 2014J is higher than other presentations
The distribution of scores for Computer Marked Assessments and Tutor Marked Assessments is different
Page 4 Relationship
I used a measure Percentage_Below40 (%) =
DIVIDE(
COUNTROWS(FILTER('studentAssessment_BBB', [score] < 40)),
COUNTROWS('studentAssessment_BBB'), 0) * 100
to calculate the fail percentage for each assessment.
The final words