ESG Analysis for Pfizer
Pfizer is one of the biggest multinational biopharmaceutical companies and medicine suppliers with a robust research capacity (MarketLine, 2021). Its revenue dramatically increased to over 24 billion U.S dollars with the Covid-19 vaccine in the Third Quarter of 2021(Statista, 2021).
Environmental, social and governance (ESG) scores in today’s markets evaluate the sustainable effort of companies, representing the deduction of footprint and organising eco-friendly activities, maintaining the relationship with humans, and testing the transparency of management structure (Dyllick and Hockerts, 2002). ESG scores have triggered a broader concern about the company's corporate social responsibility.
Chapter 1 Project Overview
Objects
This empirical analysis has 3 objectives.
Identify Pfizer company’s position in the pharmaceutical industry.
Visualise the trend of business aspects in Pfizer from 2016 to 2018.
Apply linear regression to disclose the relationship between total assets and ESG scores.
Brief
The process includes data cleansing, modelling, visualisation, and combining statistics to detect the rationality of the equation.
The project shows that Pfizer has a strong foundation, including tremendous assets and sufficient employees; conversely, it is on a middle-level of the biopharmaceutical companies regarding return on assets and Tobin’s Q ratio, which means Pfizer needs to focus on arousing development potential. Moreover, the regression model indicates that the ESG score can efficiently promote total assets; the relationship is that total assets increase by e5.2366 million U.S. dollars when environmental and governance disclosure scores increase by one unit.
Dataset
The dataset and corresponding dictionary can be found in the Data folder. The dataset contains all S&P 1500 companies listed in the US stock market over three years 2016 - 2018.
Features for each company:
Ticker
Name
Year
ISIN Number
SIC Code
GICS Industry
Country or Territory of Domicile
Number of Employees
Total Assets
R&D Expense
R&D Expense Adjusted
Operating Expenses R&D
Cash and Cash Equivalents
Environmental Disclosure Score
Social Disclosure Score
Social Disclosure Score
Governance Disclosure Score
Tobin's Q Ratio
Return on Assets
Return on Common Equity
Gross Margin
Chapter 2 Data Gathering
Import Data
Data covers 326 industries. The data includes 4518 rows and 20 variables. Most are quantitative results and collect financial information like total assets, return on assets, and so on; it also includes behaviour scores from external institutions like environmental disclosure score, social disclosure score and governance disclosure score.
You can find the data and Jupyter Notebook on my GitHub.
import pandas as pd
import numpy as np
import matplotlib.pyplot as plt
import seaborn as sns
import statsmodels.formula.api as smf
import statsmodels.api as sm
from statsmodels.stats.outliers_influence import variance_inflation_factor
from statsmodels.formula.api import ols
df = pd.read_csv("./SP1500_Raw Dataset_Data Analytics in Business Assignment_2021.csv")
df.count()Chapter 3 Biopharmaceutical Company
The chapter is to achieve the first objective - identify Pfizer's position in the biopharmaceutical industry.
Step 1: Use SIC Code 2834 or 2836 to narrow the range of companies (SIC Code 2834 - Pharmaceutical, SIC Code 2836 - Biological Products).
Step 2: Identify metrics
name
year
country or territory of domicile
total assets
the number of employees
return in assets
R&D expense adjusted
environmental score
Tobin's Q ratio
return on assets
Step 3: Drop NaN values to guarantee the rationality of results and figures.
Step 4: Calculate mean, median, maximum and minimum values.
Step 5: Visualise these metrics for comparison.
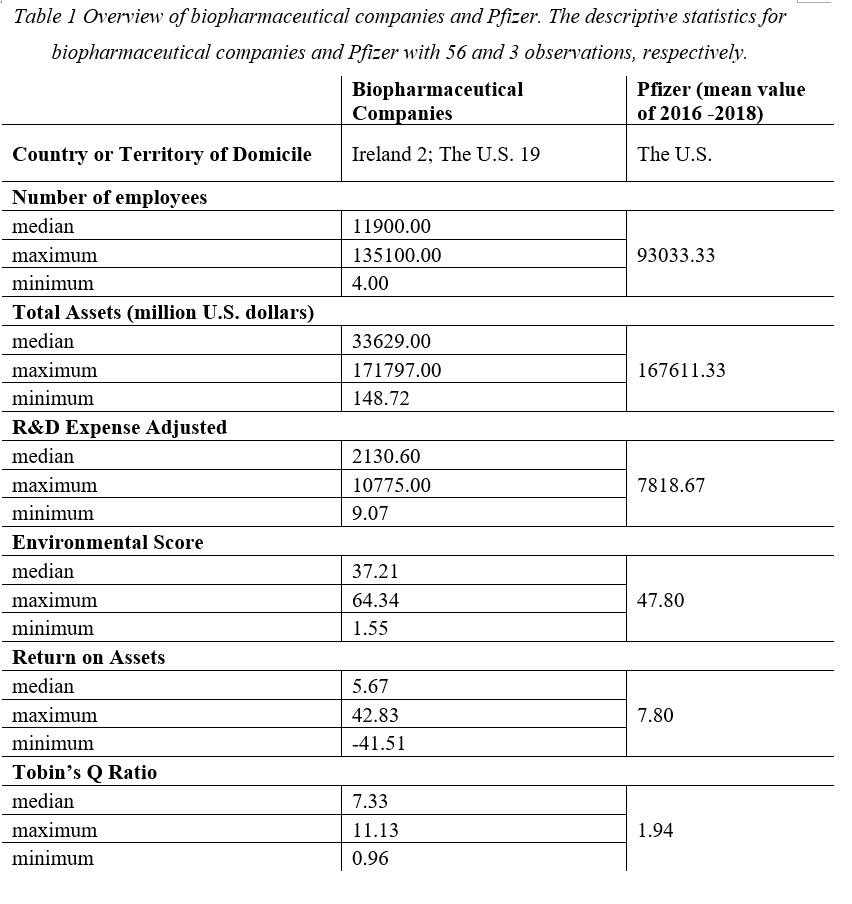
Table 1 shows the descriptive statistics of biopharmaceutical companies with chosen variables and puts Pfizer's data aside to locate its performance level. There are 21 biopharmaceutical companies, like AbbVie, Amgen, and so on. Two companies are in Ireland (Endo Internation PLC and Perrigo Co PLC), and the headquarters of 19 companies are in America.
Pfizer is an American corporation, and its headquarter locates in the U.S. as well. Pfizer is generally higher than the average level except for Tobin's Q ratio evaluation; the median value of the cohort is 7.33, while Pfizer only scored 1.94. The data of Pfizer is near the maximum value in employees and total assets aspects.
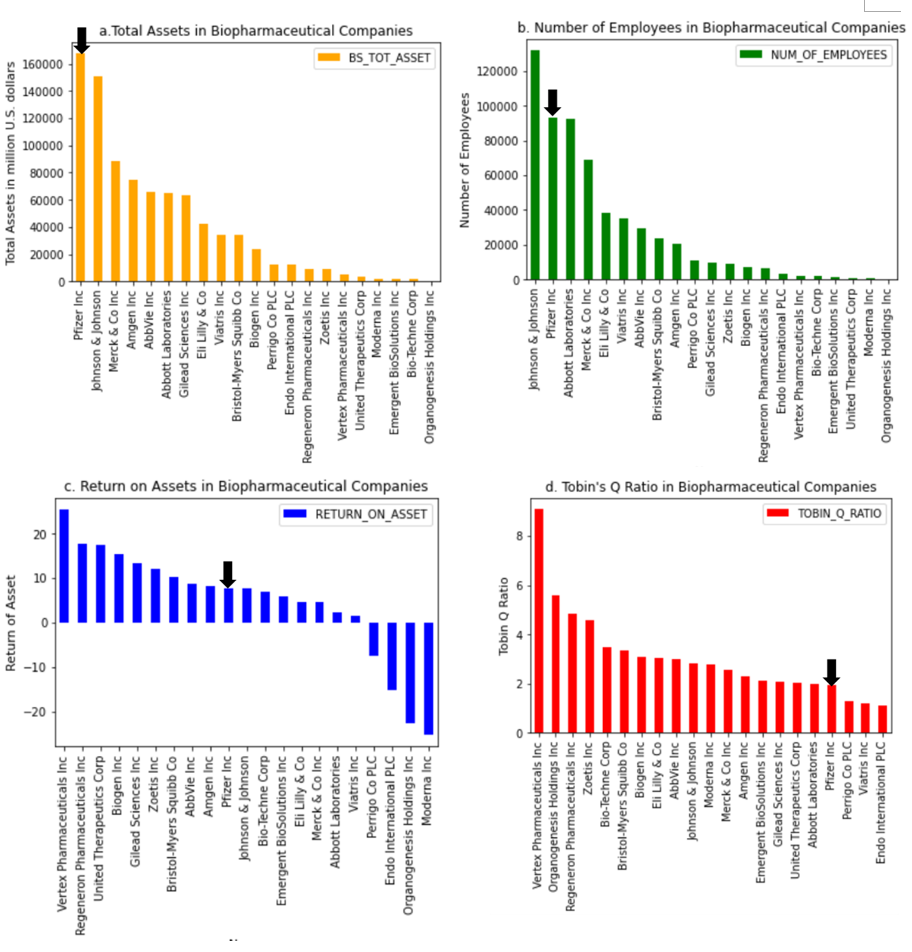
Figure 1 uses 4 bar plots covering (a) total assets; (b) the number of employees per year; (c) return on assets; (d) Tobin's Q Ratio and gives ranking information about the position of Pfizer in the cohort. Pfizer ranks among the highest according to total assets and has sufficient employees; the number is lower than Johnson & Johnson with over 120,000 employees. Regarding the prospect's relevant indicators (Return on Assets and Tobin's Q Ratio), Pfizer does not have strengths over other companies; it is the fourth bottom of the cohort comparing Tobin's Q Ratio.
Chapter 4 Development of Pfizer
The chapter is to achieve the second objective - to visualise the trend of business aspects in Pfizer from 2016 to 2018.
Step 1: Create a new data frame for Pfizer
Step 2: Identify the analysis variables
total assets
the number of employees
return on assets
Tobin's Q Ratio
R&D Expense Adjusted
Environmental disclosure score
Step 3: Use line charts to describe the developing trend of Pfizer from 2016 - 2018
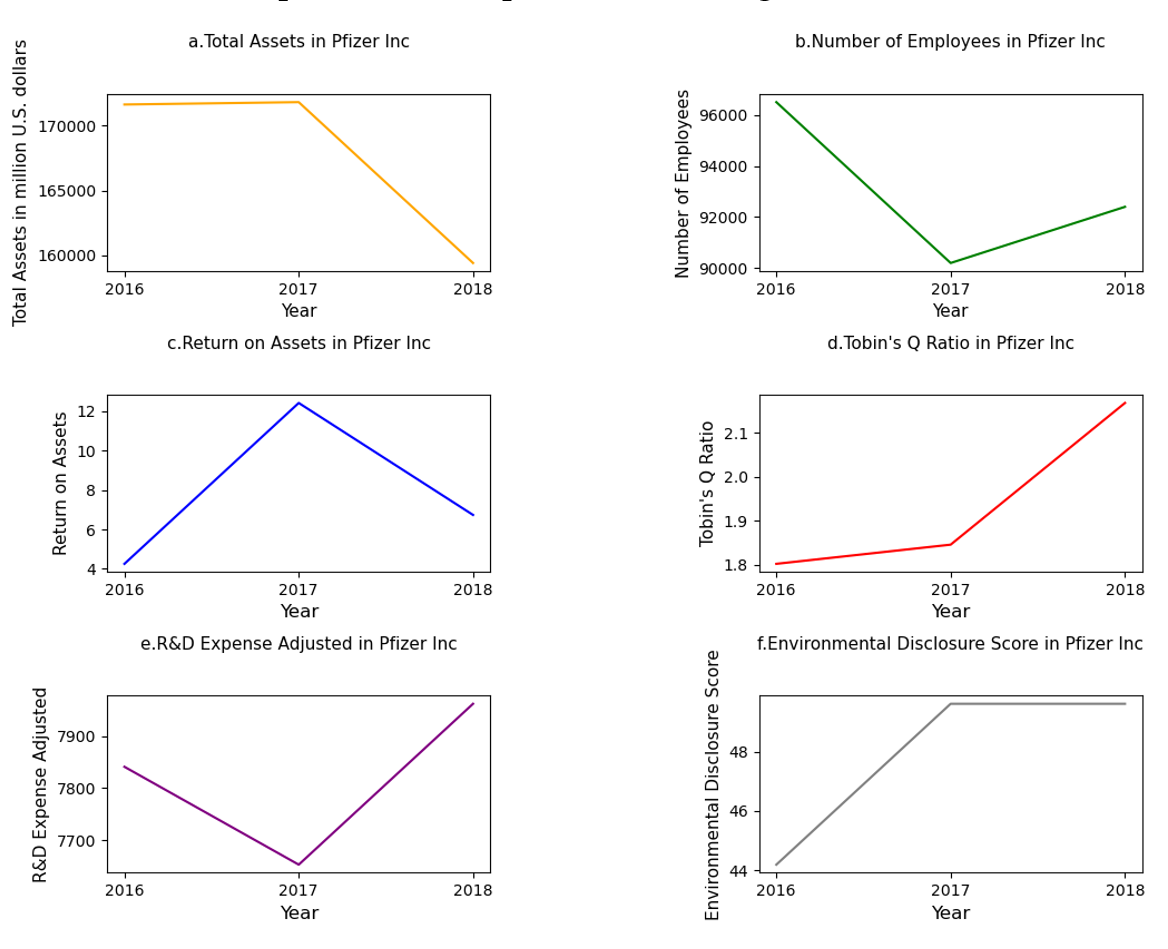
Figure 2, with time-series line graphs, demonstrates Pfizer's financial aspects. Firstly, the change of total assets from 2016 to 2018 has shown that Pfizer did not have excellent performance in 2018; the assets dropped from over 170,000 million U.S. dollars to below 160,000 million U.S. dollars while the number of employees experienced a slight decrease then increased to around 92,000 in 2018. Then using return on assets and Tobin's Q ratio as indicators of company development prospects demonstrates Pfizer tried to increase the influence and management of the company. However, Pfizer has not performed well with middle-level ranking results in Figure 1. Similarly, Pfizer continued to invest in R&D and disclosure environmental information.
Chapter 5 Relationship between the total asset and ESG score
The chapter is to achieve the last objective - apply linear regression to disclose the relationship (total assets & ESG scores).
Step 1: Drop NaN values and outliers of independent variables (3-sigma method) - get 1,965 efficient rows
Step 2: Lag ESG scores to the next year (the effect of scores needs time)
Step 3: Log total assets (the distribution is skewed)
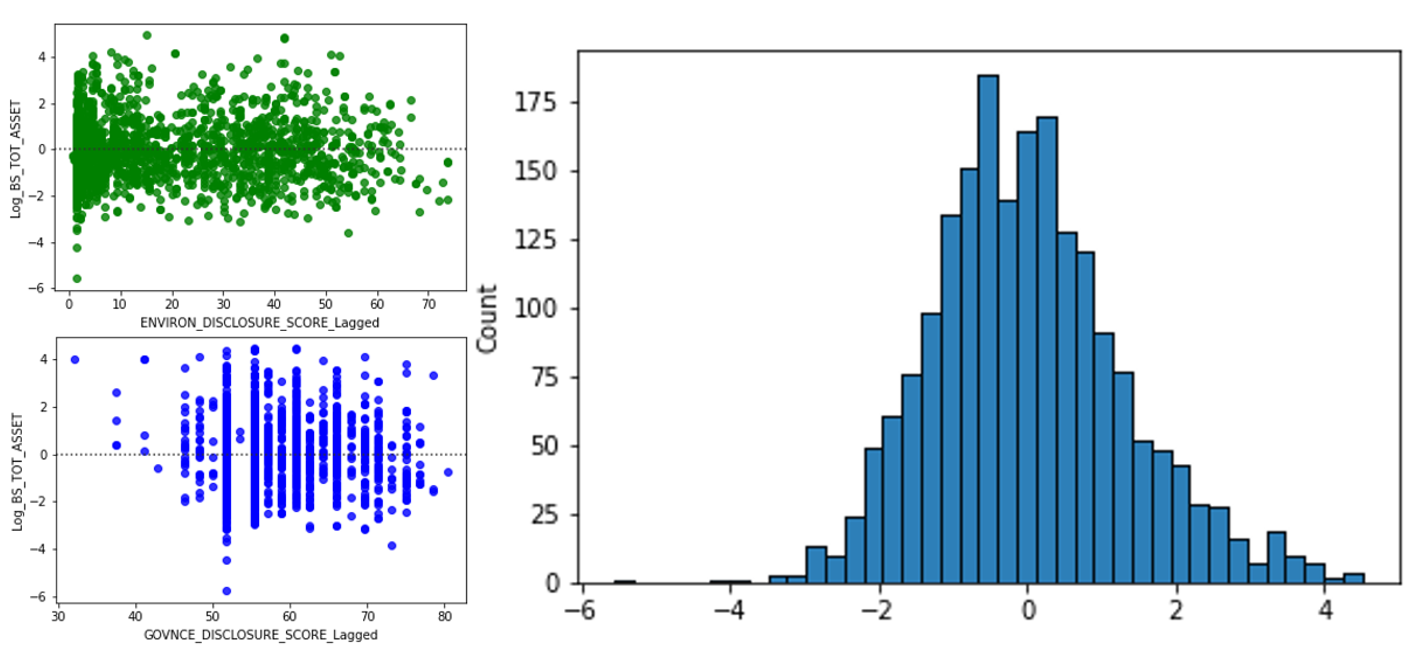
Figure 3 visualises the scatterplots of environmental, social, and governance disclosure scores V.S. the ln(total assets), respectively. Generally, the contribution of variables is average, and it is easy to observe a positive relationship between independent and dependent variables. The scatterplots can expect the coefficients to be positive in the equation. Consequently, the least square generates the parameters and other indexes to quantity the relationships.
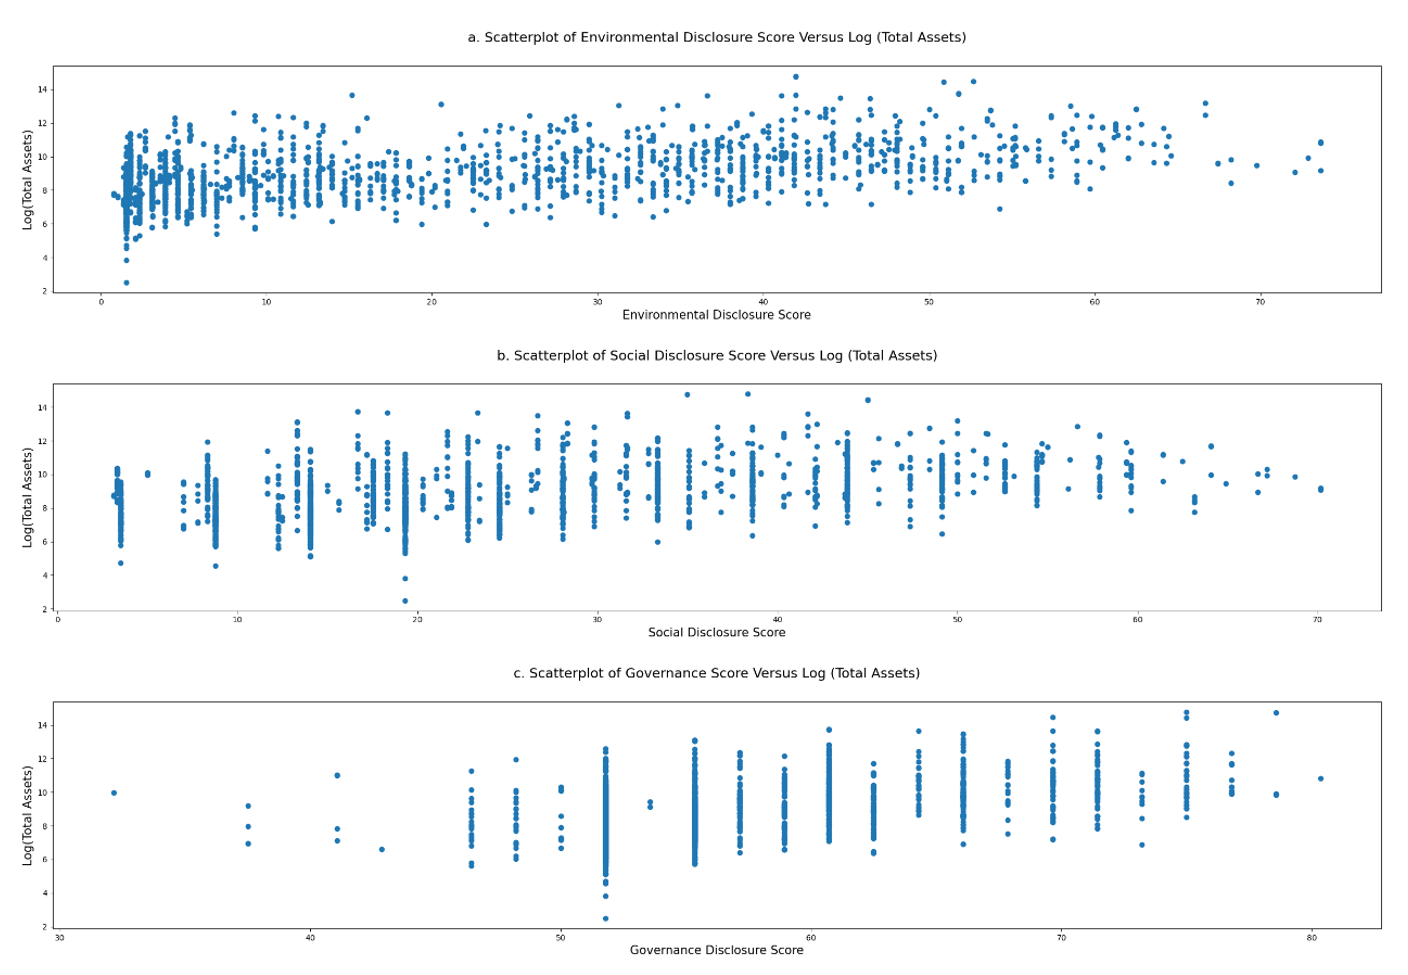
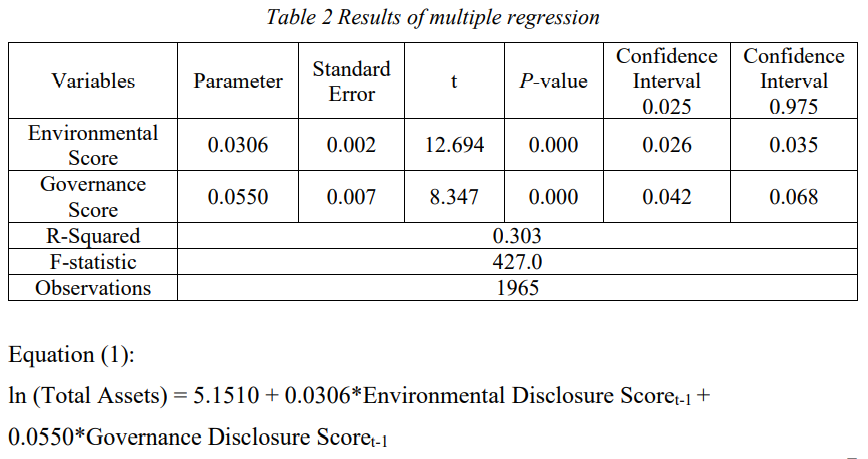
Table 2 presents the results of the regression. Of note, the social score variable is excluded from the equation because, in the first attempt, the P-value of the social disclosure score is 0.302, which means the relationship is not significant. Hence, the result only includes two independent variables: environmental and governance disclosure scores.
In equation (1), t-1 means lagging scores by one year. The coefficients are 0.0306 and 0.0550, P-values are less than 0.05, which means the relationship is significant. For every one-unit increase in environmental and governance disclosure scores last year, total assets will increase by e5.2366 million U.S. dollars this year. The direct impact is significantly positive.
Chapter 6 Evaluation of model
The chapter is to prove the rationality of the model.
Step 1: The distribution of residuals
Step 2: The histogram of ln(total assets)
Step 3: Test multicollinearity with the VIF values
The figures show (1) the distribution of residuals is average in the left residual plots; similarly, the histogram is well-shaped and symmetric. The three graphs indicate that the errors are normally distributed, and heteroscedasticity is not a violation. (2) Multicollinearity is not a problem when the VIF values are around 2.2 in the VIF table.

Chapter 7 Conclusion and discussion
Pfizer
Pfizer occupies the leading position in the biopharmaceutical industry but lacks strong growth potential when ranking return on assets and Tobin’s Q ratio. According to MarketLine (2021, p.72), ‘Robust research and development capabilities, operational performance and business performance of innovative health segment are the company’s major strengths, whereas revenue remains the cause for concern.’ Corresponding with the trend in Figure 1a, Pfizer has reported a decrease in sales data because investors waited for strategic mergers and acquisitions (M&A) (Jared S, 2018). In that case, managers at Pfizer need to consider how they deal with urgent situations and increase assets.
ESG scores
At the same time, the ESG scores are involved in the S&P 1500 and have become an important indicator for evaluating companies and providing sustainable perspectives for investors (Huang and Shell, 2021). Most research has shown that the ESG score positively impacts companies’ finance (Qiu et al., 2016); however, the ESG score does not always promote financial performance in a specific context. For example, the relationship between ESG score and financial performance is negative in Latin America because of geographic factors (Duque-Grisales and Aguilera-Caracuel, 2019). The association features change with external factors. For example, the social disclosure score is a positive factor for market value (Qiu et al., 2016), while this essay’s modelling does not demonstrate the relationship. Another case is that environmental disclosure score contributes most to improving credit rating (Zanin, 2021). Although the association features are slightly different, the positive relationship that the model has mentioned is still rational considering the influence of changes in various contexts.
Outlook
Additionally, the ESG score is lower than average in the biopharmaceutical industry. The outlook of the whole biopharmaceutical industry should change. For example, the insurance industry has a higher score than average because of the positive role of connecting employees and corporations (Banham, 2021). Unexpectedly, many biopharmaceutical companies have relatively lower ESG scores (Cooke, J. R. 2020). The reason is that pharmaceutical companies are profit dominated rather than ethical standards. In that case, the public expects the pharmaceutical industry to develop in ESG relevant direction that can help improve the population's health (Desmyter, 2020). Win-win results and joint development are general trends, so decision-makers in Pfizer should value the importance of ESG in the operational strategies. However, Pfizer has realised the significant position of ESG scores. In Pfizer’s annual review in 2020, it is easy to find that Pfizer had underlined the ESG section in the report. In the chapter, Pfizer addressed ESG-relevant indicators and set goals for further sustainable development (Performance | Pfizer 2020 Annual Review, 2021). Pfizer’s behaviour is consistent with the importance of ESG development that the model suggests.
Limitations
As for the model, it is valid after avoiding bias and other possible violations technologically. P-value and other statistical indicators have shown the relationship is significant. However, there are still issues that need to discuss. The first point is the representative of the samples; firstly, rows including missing values account for around 30%, although the analysis limited the number of variables to get more examples. Because firm size is one factor that can influence ESG score (Drempetic et al., 2019; Tamimi & Sebastianelli, 2017), the management of small companies can not provide sufficient data. In conclusion, there is a possibility that the analysis deleted smaller companies when removing missing values. Thus it is a possible cause of bias. The second point is that the S&P 1500 did not include Roche, one big competitor for Pfizer. So it is another reason why there is a chance that the model can not match the actual situation very well.
Future work
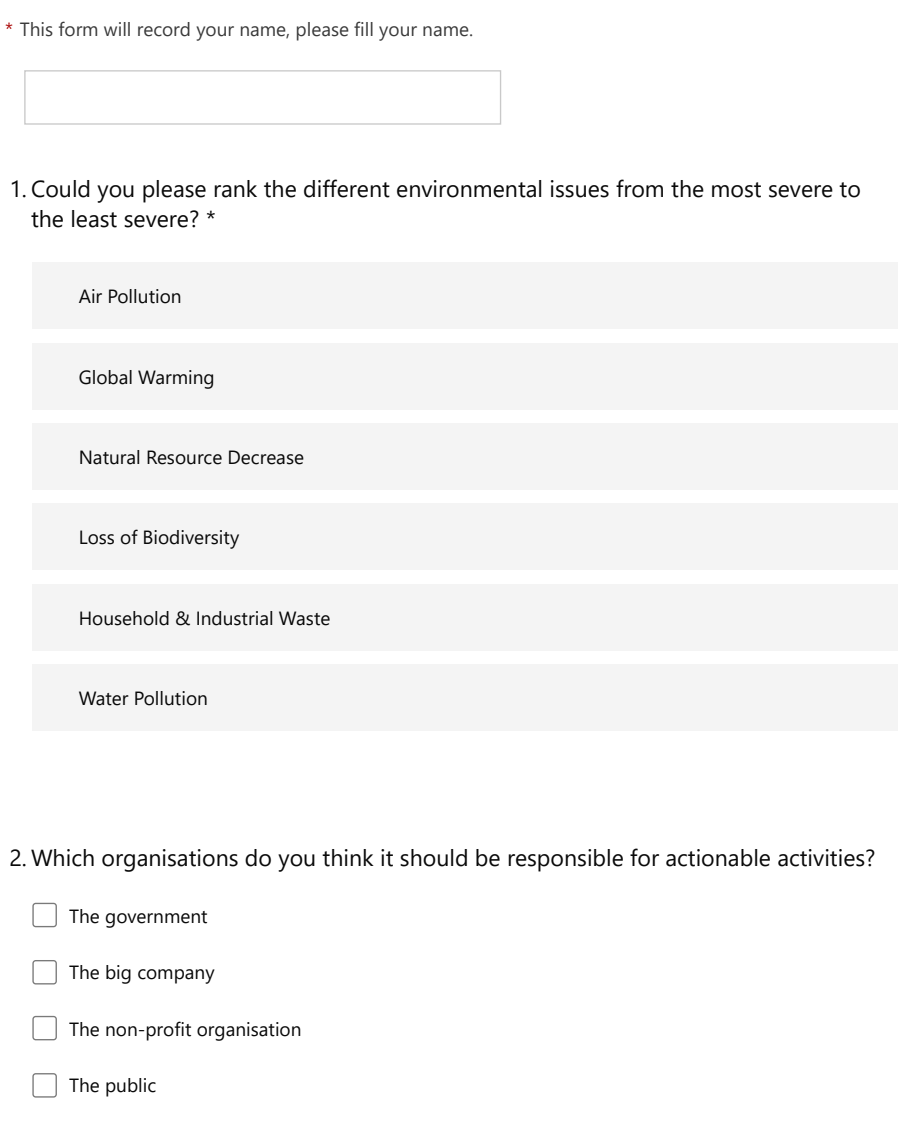
The analysis can give Pfizer and other companies some ideas regarding their development direction. For example, Pfizer can identify detailed stakeholders of environmental, and governance-relevant topics. Well-designed surveys can identify these issues and collect the reflection of customers. The figure below lists five questions that can appear in a questionnaire, such as rating Pfizer's behaviour regarding environmental protection. This kind of information can help Pfizer evaluate its position and weigh the rationality of the next steps.

References
Banham, R. (2021) ‘Ranking U.S. Insurers: How They Score on ESG Performance’, Carrier Management, 8(1), pp. 26–28. Available at: https://search.ebscohost.com/login.aspx?direct=true\&db=bth\&AN=149033527\&site=ehost-live.
Cooke, J. R. (2020) ‘Biopharma ESG Rankings Are Hamstrung by Drug Pricing, Litigation’, Bloomberg.com, p. N.PAG. Available at: https://search.ebscohost.com/login.aspx?direct=true\&db=bth\&AN=144504021\&site=ehost-live.
Desmyter, S. (2020, December 23). The ESG case for the Oxford/AstraZeneca vaccine. Financial Times. https://www.ft.com/content/0ad28950-cf97-4ae9-8b08-18fdc9ffbeb1
Drempetic, S., Klein, C., & Zwergel, B. (2019). The Influence of Firm Size on the ESG Score: Corporate Sustainability Ratings Under Review. Journal of Business Ethics, 167(2), 333–360. https://doi.org/10.1007/s10551-019-04164-1
Duque-Grisales, E., & Aguilera-Caracuel, J. (2019). Environmental, Social and Governance (ESG) Scores and Financial Performance of Multilatinas: Moderating Effects of Geographic International Diversification and Financial Slack. Journal of Business Ethics, 168(2), 315–334. https://doi.org/10.1007/s10551-019-04177-w
Dyllick, T., & Hockerts, K. (2002). Beyond the business case for corporate sustainability. Business Strategy and the Environment, 11(2), 130–141. https://doi.org/10.1002/bse.323
Hopkins, J. S. (2018) ‘Pfizer Sales Disappoint as Investors Wait for Strategic M&A’, Bloomberg.com, p. N.PAG. Available at: https://search.ebscohost.com/login.aspx?direct=true\&db=bth\&AN=140678121\&site=ehost-live.
Huang, N. S. and Shell, A. (2021) ‘Introducing the Kiplinger ESG 20. (cover story)’, Kiplinger’s Personal Finance, 75(11), pp. 18–30. Available at: https://search.ebscohost.com/login.aspx?direct=true\&db=bth\&AN=152570248\&site=ehost-live.
MarketLine Company Profile: Pfizer Inc. (2021). In Pfizer Inc. MarketLine Company Profile (pp. 1–88)
Performance | Pfizer 2020 Annual Review. (2021). Pfizer 2020 Annual Review. https://annualreview.pfizer.com/performance#esg-signpost
Qiu, Y., Shaukat, A., & Tharyan, R. (2016). Environmental and social disclosures: Link with corporate financial performance. The British Accounting Review, 48(1), 102–116. https://doi.org/10.1016/j.bar.2014.10.007
Statista. (2021, November 25). Pfizer’s quarterly revenue 2010–2021. https://www.statista.com/statistics/254351/quarterly-revenue-of-pfizer-since-2006/
SIC Code 2834 - Pharmaceutical preparations. (2021, May 7). SIC & NAICS Codes, Company Search, Business Lists - SICCODE.Com. https://siccode.com/sic-code/2834/pharmaceutical-preparations
SIC Code 2836 - Biological products exc. diagnostic. (2021, May 7). SIC & NAICS Codes, Company Search, Business Lists - SICCODE.Com. https://siccode.com/sic-code/2836/biological-products
Tamimi, N., & Sebastianelli, R. (2017). Transparency among S&P 500 companies: an analysis of ESG disclosure scores. Management Decision, 55(8), 1660–1680. https://doi.org/10.1108/md-01-2017-0018
Zanin, L. (2021). Estimating the effects of ESG scores on corporate credit ratings using multivariate ordinal logit regression. Empirical Economics. https://doi.org/10.1007/s00181-021-02121-4