Revenue Strategy for Google Merchandise Store
Chapter 1 Project Overview
Background Information
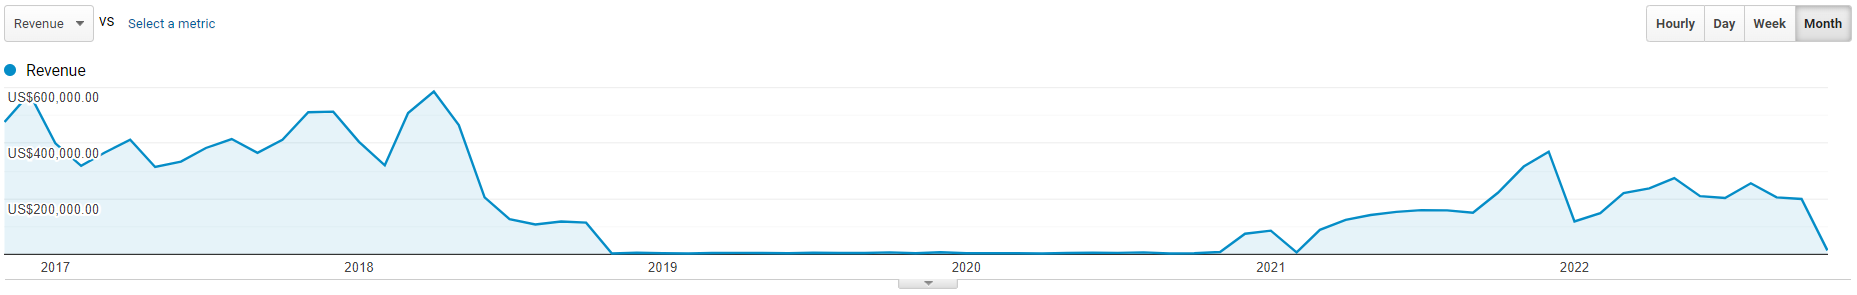
Google merchandise store is an online platform that sells google-branded products. The Google Analytics platform (a web analytics tool that stores historical marketing data and tracks the customer's real-time status) shows that in December 2017 and April 2018, the sales performance reached the highest peak – $578,246 and $585,960. But after June 2018, the trend showed a considerable decline until the lowest point ($3,269 in November 2018). The significant decrease should be that the European Commission took a hard line on antitrust behaviour and fined Google €2.42 billion in June 2017 and €4.34 billion in July 2018, respectively (European Commission, 2017, 2018). The situation lasted for two years, and the revenue started to increase in December 2020, but the peak value was much lower than before. To help the Google merchandise store recreate its historical prospects, this report uses the google analytics platform to define customers' personas and provide feasible strategies to increase revenue.
Dataset
Data comes from Demo Account (54516992) – UA – Google Merchandise Store (UA-54516992-1) - 1 Master View (92320289).
The time range is the first quarter in 2022; the objective of comparison in the first quarter (from January 1 to March 31) in 2021, considering seasonality may influence the performance, although there are still many uncontrollable factors like pandemics (Ehrenthal et al., 2014).
Detailed questions
What is the persona (an overview of customers in marketing) of customers, and what are the characteristics of target customers?
What are the most popular products? How profitable are products?
What are customers’ shopping habits?
What are the differences between new users and returning users?
What happened during the whole shopping journey? Which stages do most consumers leave before payment?
Chapter 2 Web Metrics
The percentage of conversions
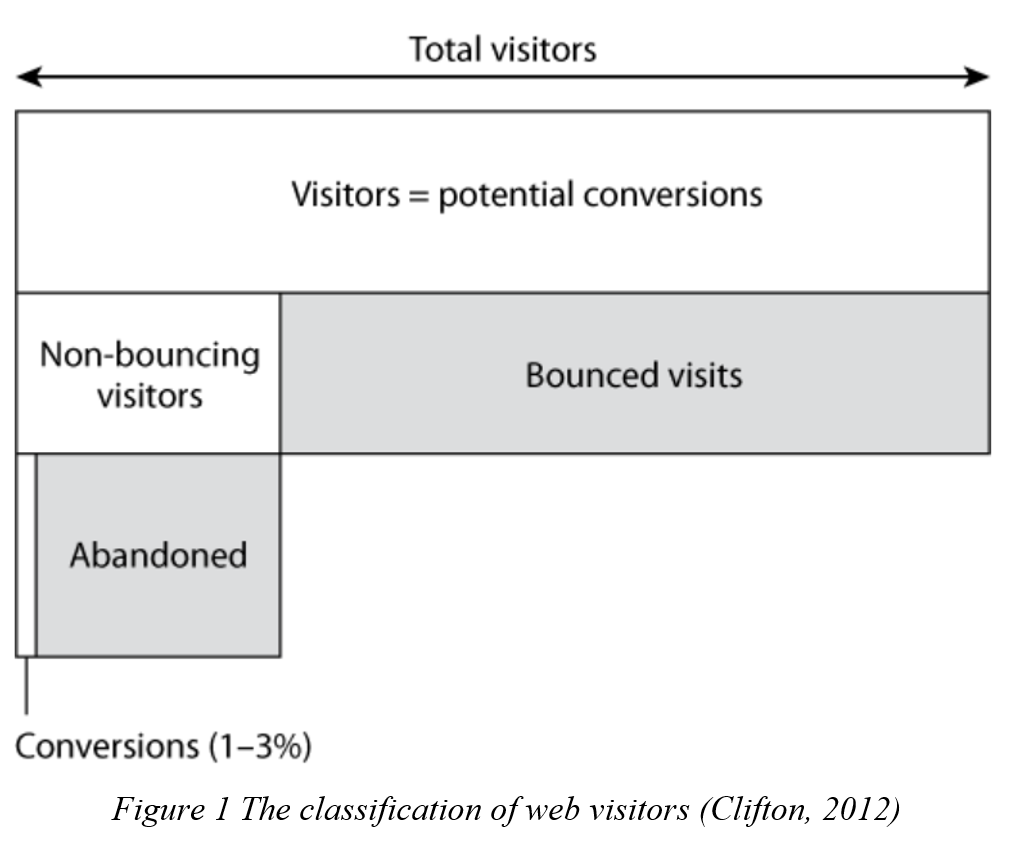
Understanding consumers’ activities is the first step for web analysis. As figure 1 shows, total visitors represent visitors who have entered the website; potential conversions mean visitors are likely to shop for products. Most visitors leave the website without further exploration, which are bounced visits; the left visitors may add items to carts, but only 1 – 3 % of total visitors will pay for products. This small part can be counted as conversions.
Objectives and key results (OKRs)
To achieve the increasing revenue goal, data analysis focused on five objectives and key results (OKRs) to answer five questions mentioned in the introduction:
Identify what group of customers purchase more and depict the demographic features of customers.
Identify the most popular or profitable products and find the features of top-selling products.
Identify the pattern of activity of customers, such as the length of durations, used devices, and channels.
Explore the different performance patterns between new users and returning users.
Identify barriers during online activities, such as the stages where visitors are likely to give up making payments.
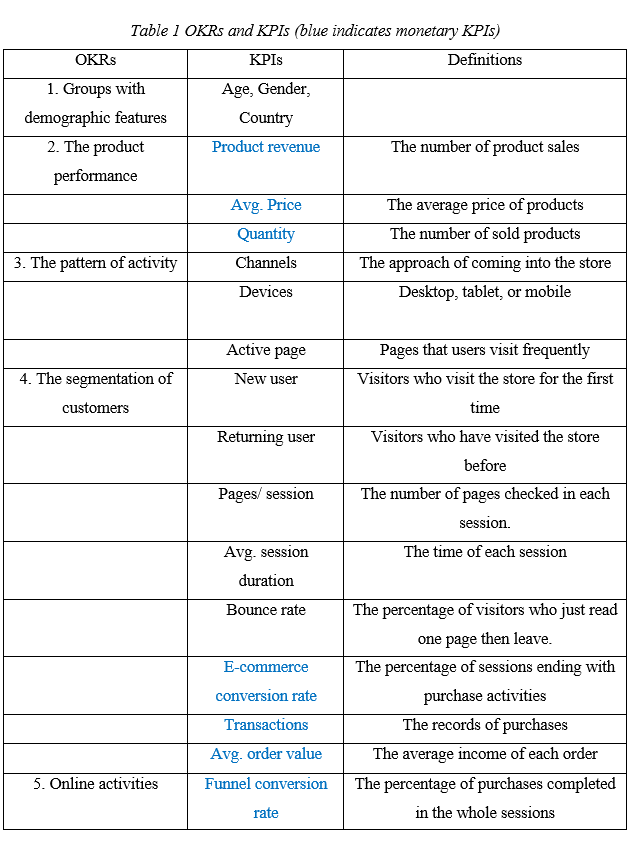
Each OKR needs corresponding key performance indicators (KPIs). Table 1 shows what KPIs are measured and the definitions of KPIs.
Hypotheses
Five hypotheses are listed below to solve five questions and achieve five OKRs.
A specific group (maybe young women in the United States) has shown strong intentions to purchase Google-branded products.
Clothes with the Google brand logo attract most consumers considering their practicability.
Consumers often use mobile phones to complete a purchase.
Returning users contribute more to the revenue.
Consumers often leave after they have added products to their carts.
Chapter 3 Persona of customers
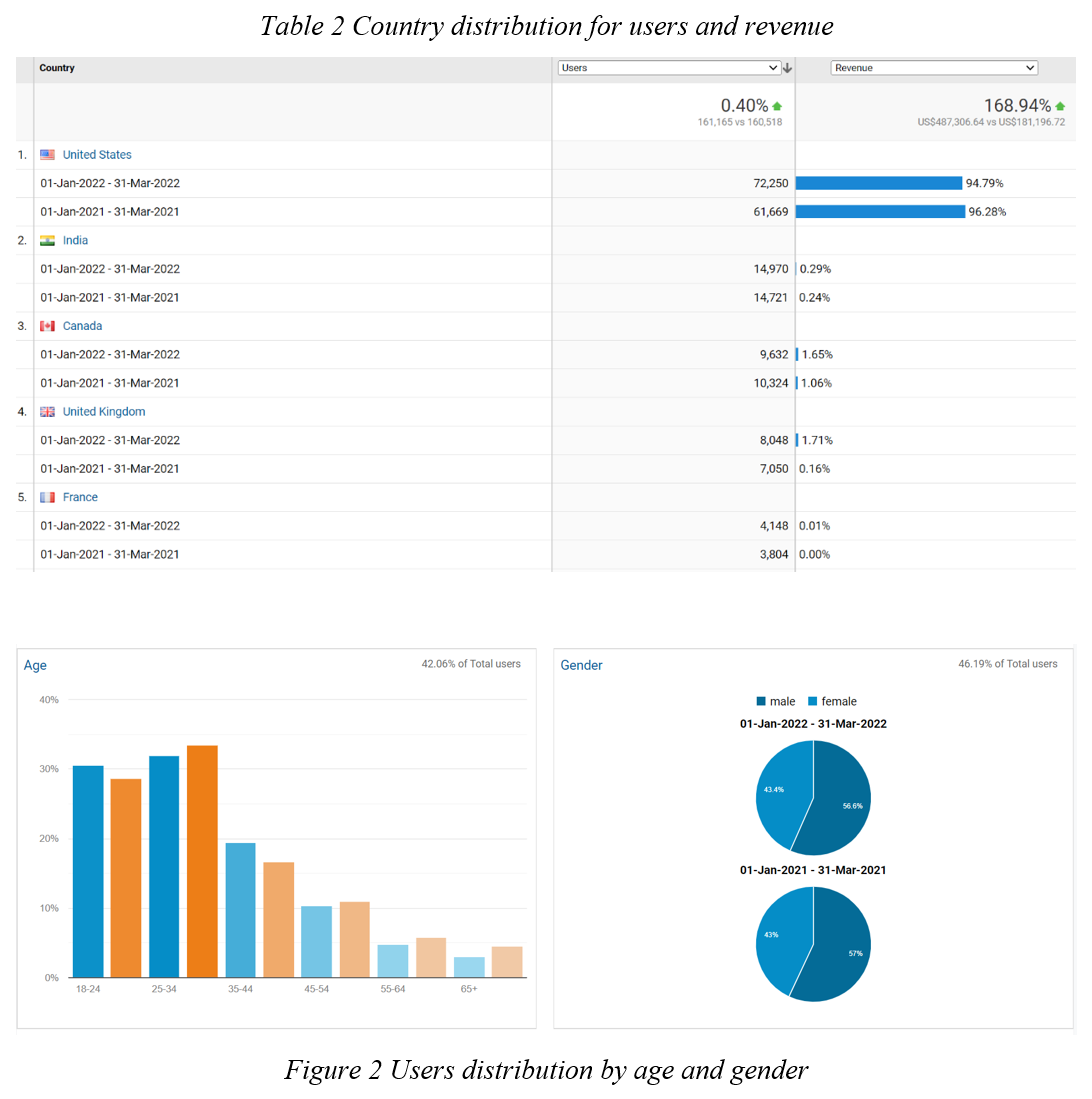
The first analysis depicts the current customer; a persona can form a coherent picture of consumers with better clarity and completeness (Sinha, 2003; Spiliotopoulos et al., 2020). Table 2 indicates that the United States has contributed the most users and revenue; the interesting point is that India has the second most users, but the payment is not high enough.
Figure 2 below illustrates that the 18-24 and 25-34 groups use google merchandise store more, and the male uses the online store slightly more frequently than females. Men purchase more than women in the store violates the public consensus that women drive most of total purchasing (Nelson, 2020). It may be caused by the attraction of the Google brand for men. The first hypothesis should be changed because young men intend to purchase Google-branded products more. It is worth noting that the demographic data are only available for about half of the total users (the upper right corner of the graphs has annotated the number).
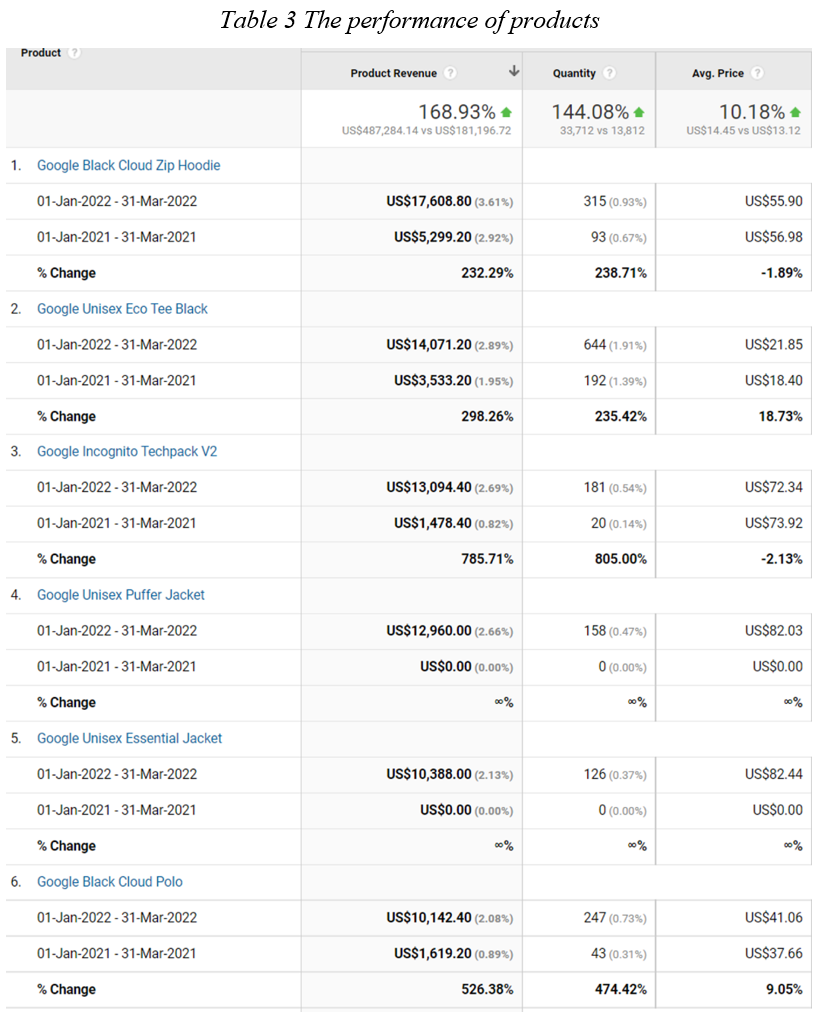
Chapter 4 The performance of products
The product performance reflects customers’ mindsets or insights (Charm, 2020). Table 3 below presents the six most famous products: hoodies, T-shirts, jackets, polo, and backpack. From the data, it is easy to see that 5/6 of the most popular products belong to clothing and 1 is the backpack, and the price did not change a lot, but the quantity has added a lot. For example, the sales volumes of Google Black Cloud Zip Hoodie and Google Unisex Eco Tee Black products have over doubled compared to the same quarter last year, and there are two new items which did not come into markets in the first quarter of 2021 have become popular too, they are both jackets. The ranking of popular products shows that consumers may pursue practical fashion and brand satisfaction simultaneously and supports the second hypothesis.
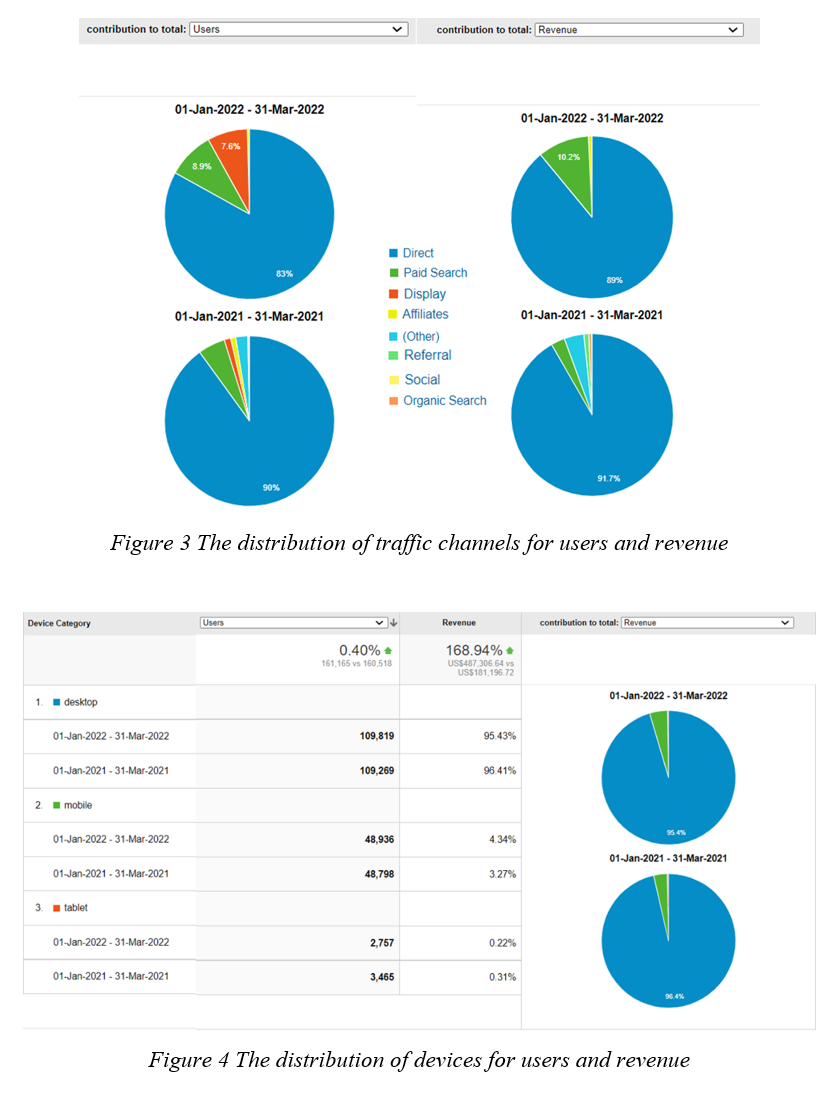
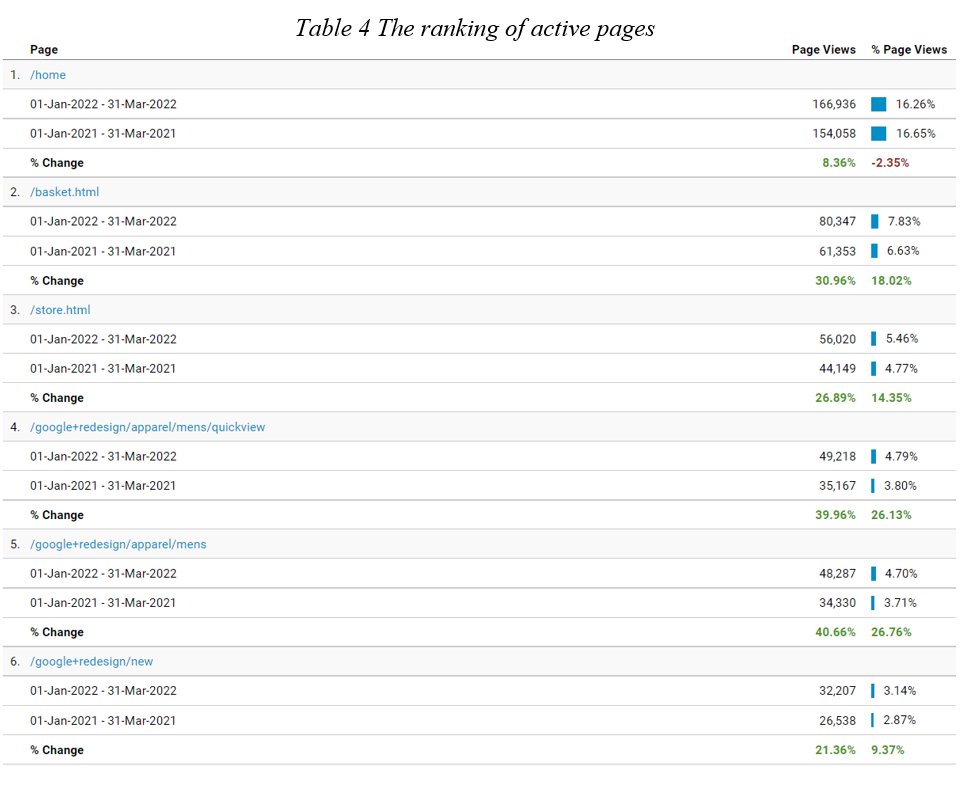
Chapter 5 The pattern of activity
The pie charts in figure 3 below compare the number of users and revenue in different traffic channels. What stands out in the four charts is that direct channel dominates the media. Comparing users and revenue in 2021 and 2022 shows that the paid search method has increased and contributed to the total revenue. What is interesting about the data is that although display methods brought 7.6% of the actual users, this group has no purchase activities. It seems that Google has invested in paid search and display advertising. Unfortunately, display advertising did not convert this group of users into expected revenue. Figure 4 provides an overview of purchasing devices, and the desktop was the primary tool for users rather than mobile phones, as the fourth hypothesis mentioned. Table 4 lists the most active pages, except for the home page and basket page, the fourth and fifth dynamic pages are about men's products. This phenomenon corresponds to the high percentage of men in users.
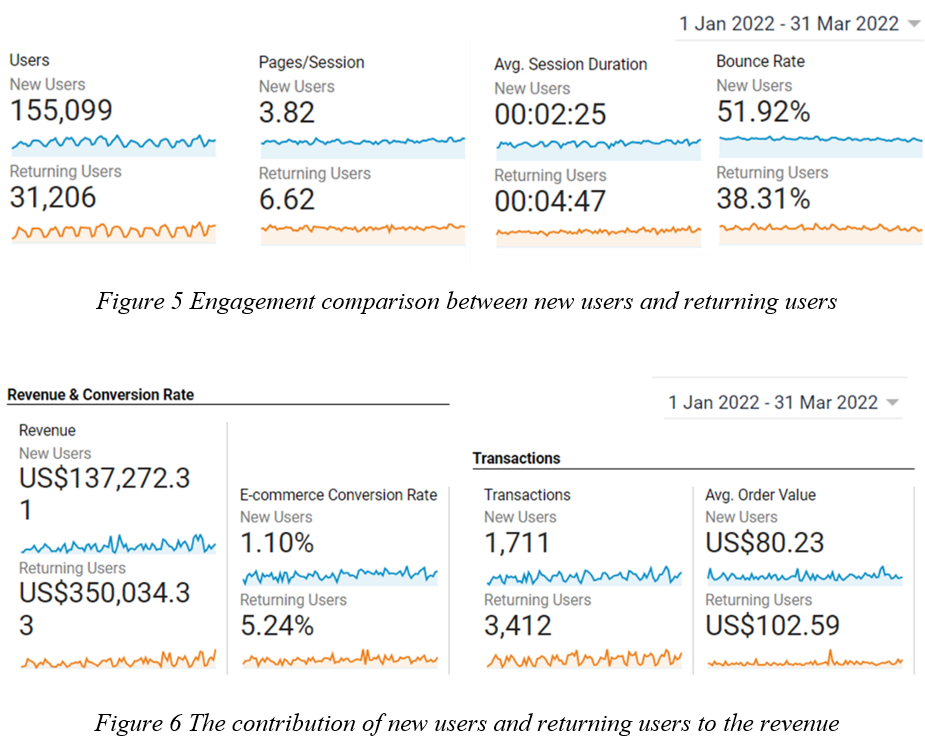
Chapter 6 Comparison between new and returning users
Understanding users’ behaviour is the premise of optimising designs or workflow; in other words, user-centred design needs an in-depth understanding of users (Holtzblatt & Beyer, 2016). Pages/session and avg. session duration are two indicators of engagement; the two indicators show to what extent users are willing to explore the content on the website. As figure 5 shows, returning users will read more pages each session, spend more time, and have a lower bounce rate than new users. The results indicate that returning users engage in the Google merchandise store more actively than new users. Naturally, returning users contribute more to the revenue, have higher e-commerce conversion rates, and have higher average order value.
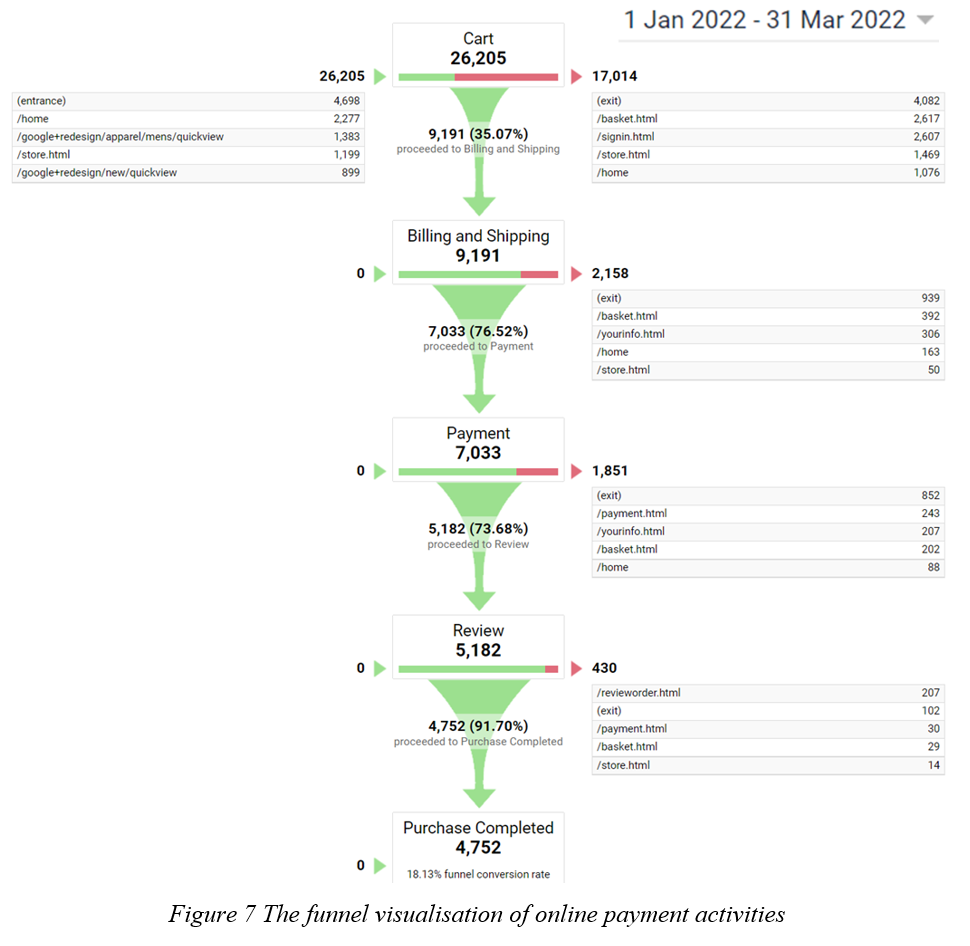
Chapter 7 The buyer's journey
A funnel diagram helps structure purchasing processes and discover where potential customers are missed (Ball, 2018; Morgan & Chavez, 2021). From this data on the chart, it can be seen that the most significant loss (red bar) happened during the conversion from cart to billing and shipping; only 35.07% of visitors came into the next steps. 18.13% of total visitors complete purchasing process. It is worth considering visitors’ experience when they add products to their carts and what factors cause some to give up purchasing. As long as the journey is guaranteed to be complete, Google merchandise store can achieve its revenue increase goal.
Chapter 8 Recommendations
Staff in the Google merchandise store can be classified into five types: the webmaster, the content creator, the e-commerce manager, the marketers, and the social media manager (Clifton, 2012). Previous data analysis may help these stakeholders to understand the current problems or potential possibilities for increasing revenue.
Action 1: segment products and advertising to meet young men’s needs. Customers’ persona has shown that most users are 18–34-year-old men in the United States. The e-commerce managers should adjust the allocation of marketing resources can mainly focus on young men; the marketers investigate items most young men like. Camping backpacks, toolboxes, earphones, and other products are listed in one study (Rutherford, n.d.). Social media managers can use tags that young men often use in virtual advertising campaigns to attract target customers.
Action 2: exploit potential customers, such as Indian consumers. The second most users are in India means this group is large enough to have substantial potential purchases. The managers can consider launching some high-quality-price ratio products if the purchase restrictions are relatively low income in India compared to high-price products (India Placed 72nd on Global List with Average Monthly Wage of Rs 32,800: Report, 2020).
Action 3: optimise the layout and design of the websites. The duration of browsing the website is short (the new users spend two minutes, and the returning users spend four minutes each session); in that case, the content creators need to think of how to ensure visitors can find the products they want. The content creator can add apparent tags and eye-catching product pictures to attract consumers and provide informative content. By suggesting similar or relevant products when customers browse (Jiang et al., 2010), customers can easily find items and directly increase customer satisfaction and purchase records.
Action 4: add convenience for customers. A study proves that the quality of online stores influences consumers’ purchase decisions and consumers are more likely to purchase in a well-designed store (Liang & Lai, 2002). Website convenience decides the success of an online store (Salehi et al., 2012). Webmasters can simplify the payment process and establish a feedback circle. The billing and shipping information can be stored in the store, and consumers do not have to input the data every time.
Chapter 9 Discussion and conclusion
Future work
Google Analytics provides informative metrics and data that can help make decisions about business activity by measuring performance and finding trends. This report uses the most common KPIs to support the achievement of OKRs, which can lead to revenue increases. However, there are lots of spaces to explore. For example, relevant metrics such as campaigns, product coupons, active visitors, etc can also be analysed. Meanwhile, data analysis perspectives can be added with more dimensions, like exploring the percentage of converters in new and returning users. These analyses can provide more ideas.
Limitations
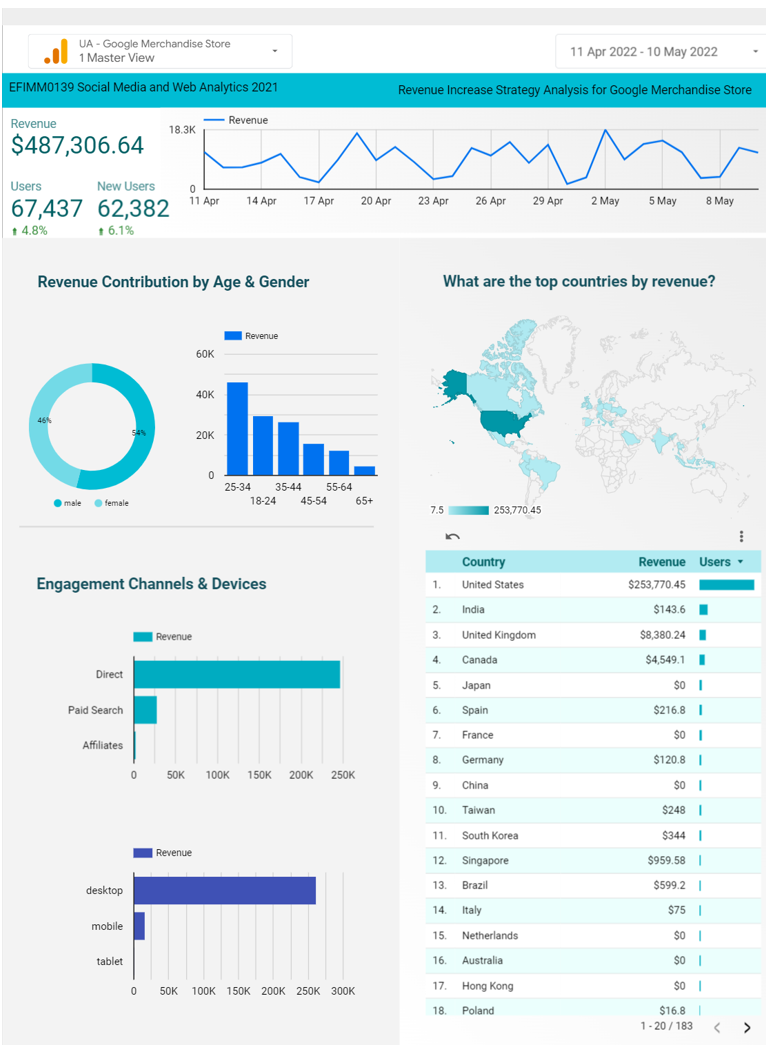
One issue is that analysts cannot access external environments like competitors’ data, and it will cause a loss of meaning comparison. Another problem is that Google Analytics does not include cost information, and this issue will influence decisions. For example, the top-selling products have low profits because the production cost is high. Google Analytics itself has two problems to overcome. One is that historical errors need to be fixed; otherwise, wrong data can be involved in the analysis and influence results. Another is privacy questions because data is open to the public, and Google needs to ensure it can protect data. Finally, the learning cost is high because the number of metrics is high in this platform, and it is not convenient to find wanted metrics. To optimise the process of data visualisation, these graphs can be put together in the Google data studio (an online data visualisation platform) when finding metrics in Google Analytics is energy-consuming. The figure below is a dashboard that extracts revenue-relevant information and puts it together.
Conclusion
This report began by identifying the aim of increasing revenue for the Google merchandise store. The analysis generated five sub-questions corresponding with five OKRs supported by KPIs to achieve the goal. The main directions are the persona of customers, the performance of products, the segmentation of customers and the workflow. According to data analysis on Google Analytics, this report found that young men are significant customers, clothes are popular items, returning users contribute more to revenue than new users, and customers may give up purchasing after adding products to their carts. Based on these results, this report suggested that stakeholders (managers and practitioners) segment customers and expand markets by attracting potential customers and increasing customers’ experience online (interface optimisation and process simplification). Google Analytics, as a web analytics tool, has shown a strong power in data analytics. Although it also has limitations, it can supplement the defects of traditional methods and provide a refreshed perspective.
References
Ball, E. (2018). Understanding the Sales Funnel. Point of Beginning, 43 (8), 15–18.
Charm, T. (2020, July 24). Understanding and shaping consumer behaviour in the next normal. McKinsey & Company. https://www.mckinsey.com/business-functions/marketing-and-sales/our-insights/understanding-and-shaping-consumer-behavior-in-the-next-normal
Clifton, B. (2012). Advanced Web Metrics with Google Analytics (3rd ed.). Sybex.
Ehrenthal, J., Honhon, D., & van Woensel, T. (2014). Demand seasonality in retail inventory management. European Journal of Operational Research, 238(2), 527–539. https://doi.org/10.1016/j.ejor.2014.03.030
European Commission. (2017). Antitrust: Commission fines Google €2.42 billion for abusing dominance as search engine by giving illegal advantage to own comparison shopping service. European Union. https://ec.europa.eu/commission/presscorner/detail/en/IP\_17\_1784
European Commission. (2018). Antitrust: Commission fines Google €4.34 billion for illegal practices regarding Android mobile devices to strengthen dominance of Google’s search engine. European Union. https://ec.europa.eu/commission/presscorner/detail/en/IP\_18\_4581
Holtzblatt, K., & Beyer, H. (2016). Contextual Design: Design for Life (Interactive Technologies) (2nd ed.). Morgan Kaufmann.
India placed 72nd on global list with average monthly wage of Rs 32,800: Report. (2020, August 28). The Economic Times. https://economictimes.indiatimes.com/news/economy/indicators/india-placed-72nd-on-global-list-with-average-monthly-wage-of-rs-32800-report/articleshow/77806437.cms?from=mdr
Jiang, Y., Shang, J., & Liu, Y. (2010). Maximizing customer satisfaction through an online recommendation system: A novel associative classification model. Decision Support Systems, 48(3), 470–479. https://doi.org/10.1016/j.dss.2009.06.006
Liang, T. P., & Lai, H. J. (2002). Effect of store design on consumer purchases: an empirical study of on-line bookstores. Information & Management, 39(6), 431–444. https://doi.org/10.1016/s0378-7206(01)00129-x
Morgan, D., & Chavez, A. (2021). Sales Funnels Are Marketing Fire. SDM: Security Distributing & Marketing, 51 (4), 26–27.
Nelson, A. (2020, February 6). Women Drive Majority of Consumer Purchasing and It’s Time to Meet Their Needs. Inc.Com. https://www.inc.com/amy-nelson/women-drive-majority-of-consumer-purchasing-its-time-to-meet-their-needs.html
Rutherford, Z. (n.d.). Online Shopping for Men: 10 Items They Can’t Resist. SaleHoo. https://www.salehoo.com/blog/online-shopping-for-men-10-items-they-cant-resist
Sinha, R. (2003, April). Persona development for information-rich domains. In CHI'03 extended abstracts on Human factors in computing systems (pp. 830-831).
Spiliotopoulos, D., Margaris, D., & Vassilakis, C. (2020). Data-Assisted Persona Construction Using Social Media Data. Big Data and Cognitive Computing, 4(3), 21. https://doi.org/10.3390/bdcc4030021