Boosting Revenues through Strategic Sales Analysis (DataCamp Capstone Project)
Chapter 1 Project Overview
Background Information
Pen and Printer Company launched a new line of office stationery 6 weeks ago. They have three sales strategies:
Email
- Customers will receive an email when the product launches, and then they will receive the 2nd email 3 weeks later.
Call
- Customers will be connected by team members, it lasts 30 mins per customer.
Email + Call
- Customers will receive an email then they will be connected by team members, it lasts 10 mins per customer.
The team would like to identify which sales strategy sell products effectively.
Data Validation
The dataset contains 15,000 rows and 8 columns before cleaning and validation. I have validated all the columns against the criteria in the dataset table:
week: from week 1 to week 6 without missing values. No cleaning is needed.
sales_method:3 categories without missing values, "email + call" category should be transformed into "Email + Call", have done.
customer_id: 15,000 unique values without missing values. No cleaning is needed.
nb_sold: numeric values without missing values, the range is 7 ~ 16. No cleaning is needed.
revenue: numeric values with 1,074 missing values. Need to remove missing values.
years_as_customer: numeric values without missing values, the range is 0 ~ 63. No cleaning is needed.
nb_site_visits: numeric values without missing values, the range is 12 ~ 41. No cleaning is needed.
state: 50 categories without missing values. No cleaning is needed.
After the data validation, the dataset contains 13,926 rows and 8 columns without missing data, the range of nb_site_visits becomes 12 ~ 37, while others keep the same.
Detailed Questions
How do the number of customers and sales differ between the three approaches?
Customer persona?
Revenue changes with time?
Chapter 2 Difference in Customers and Sales
How does the Number of Customers Differ Between the Three Approaches?
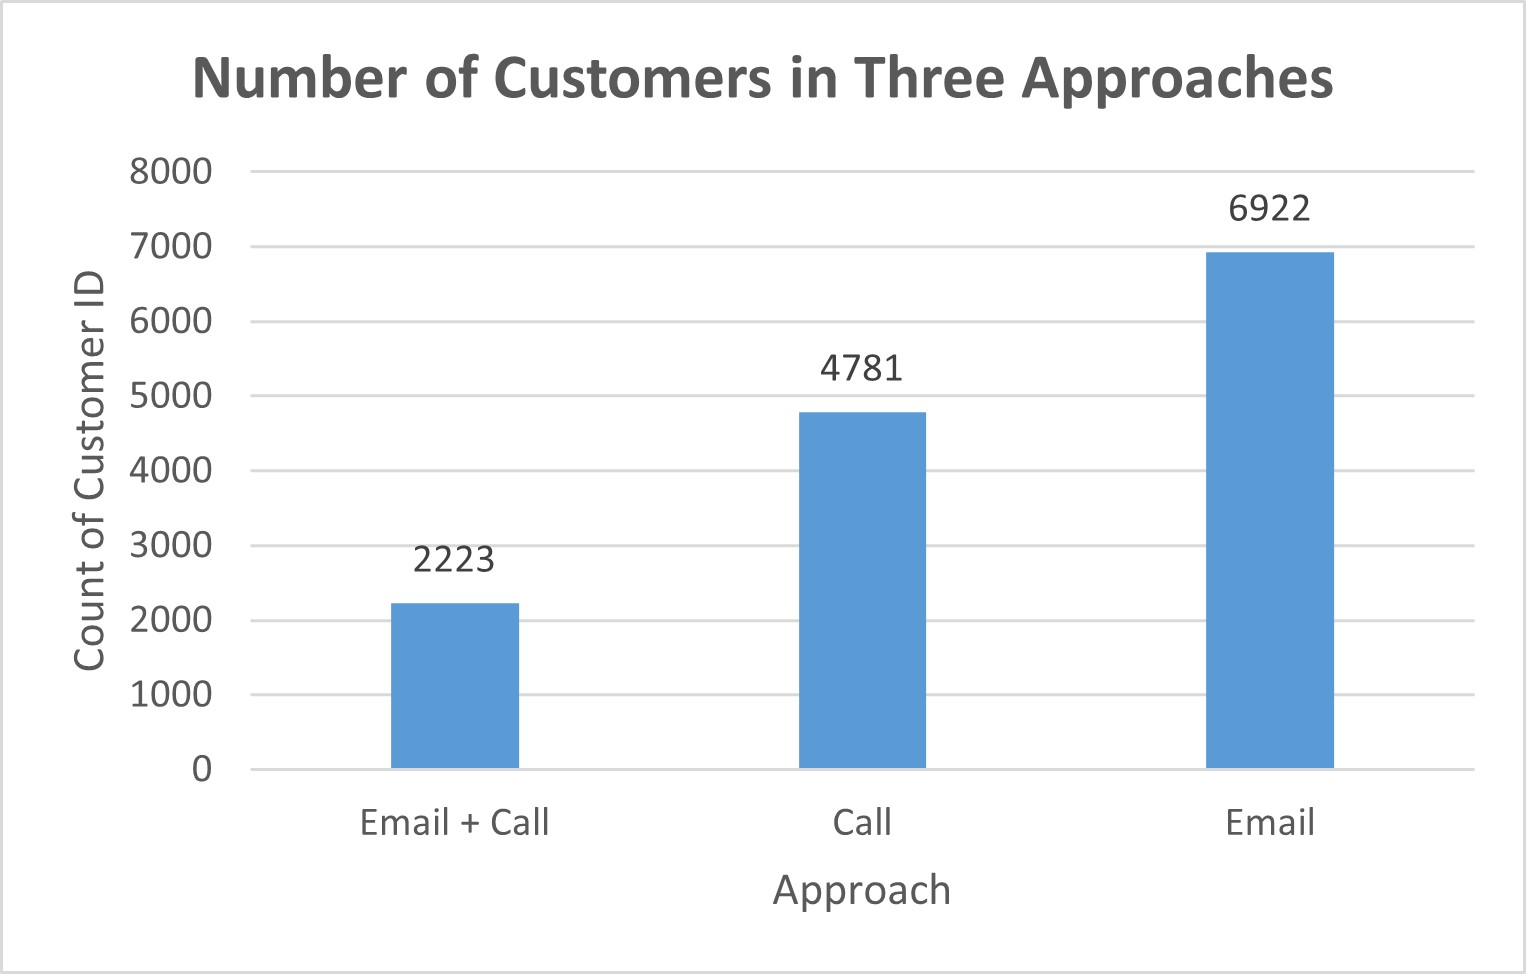
From the 6 weeks' record, we have 13,926 customers and around half of the total customers received emails when the product line was launched, and a further email three weeks later. 1/3 of customers were called by team members. Only around 2000 customers received the product information email first then called by team members. In fact, considering sending emails is easy and can shorten calling time from 30 mins to 10 mins. The group of customers who only received calls may include the email approach as well. Before taking this action, have a look at the relationship between approach and revenue in the next chapter.
How do the Sales Differ Between the Three Approaches?
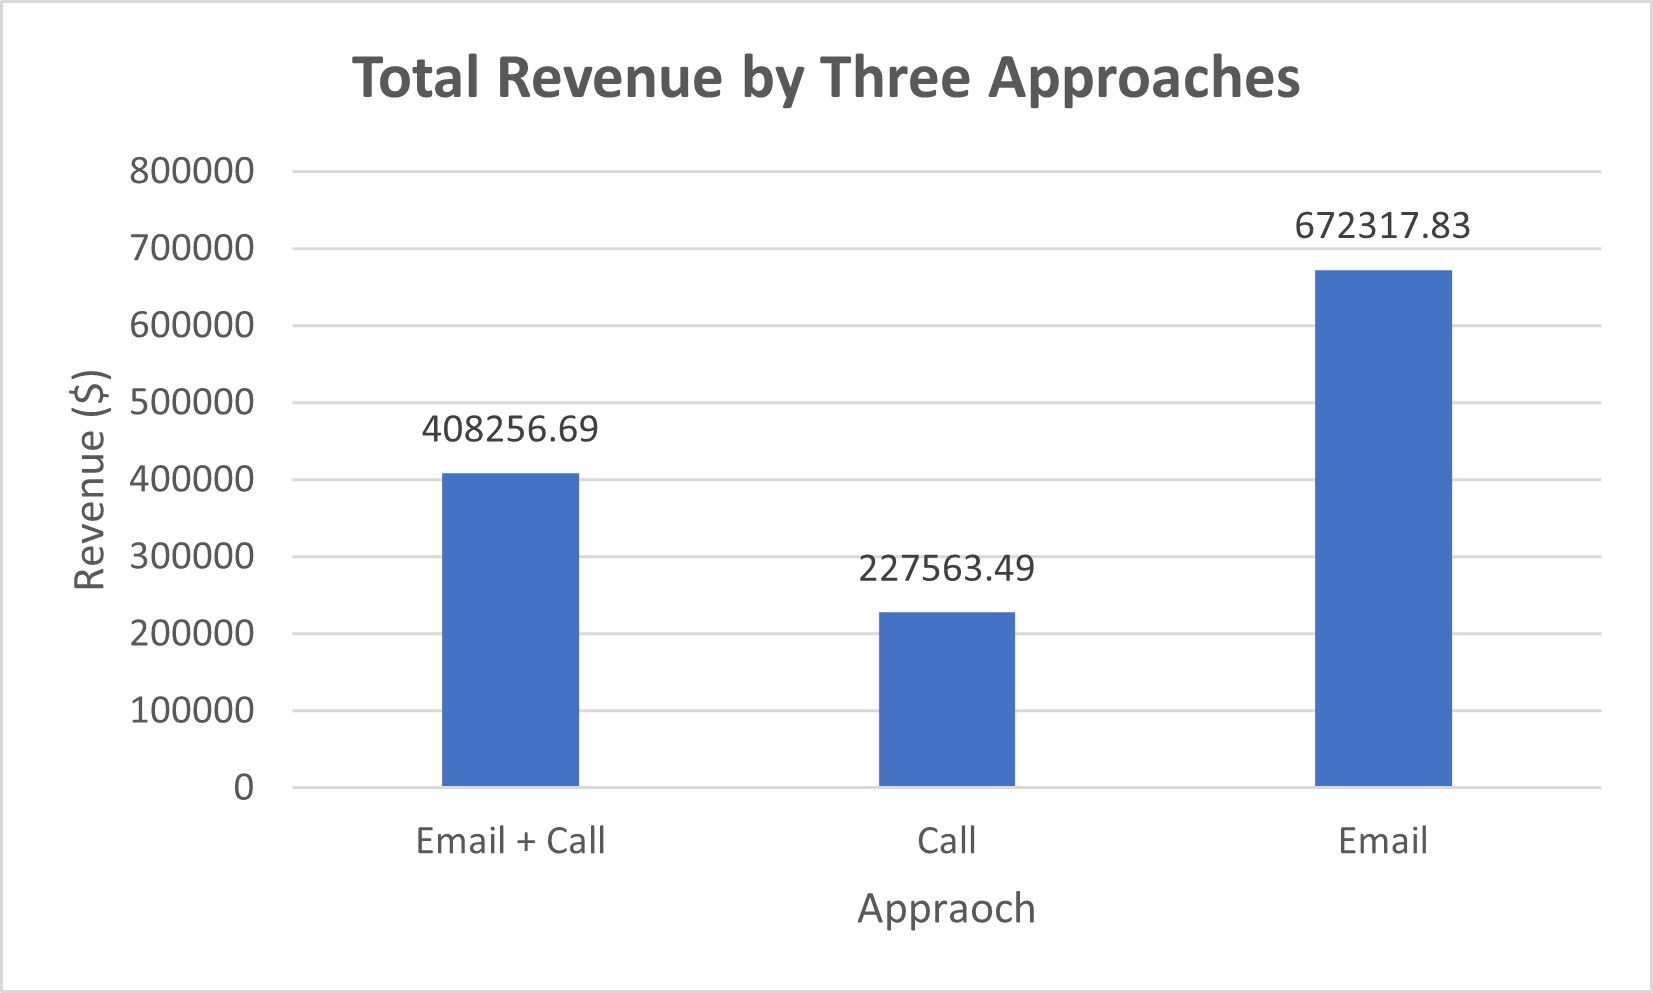
Firstly, the total revenue is 1,308,138.01 dollars after the new product was launched. The first plot divides the revenue into three parts labelled with three approaches. We can see that the majority of customers who received emails contributed 672,317.83 dollars while although the number of customers who received emails and calls is the least, they still contributed 408,256.69 dollars for the total revenue.
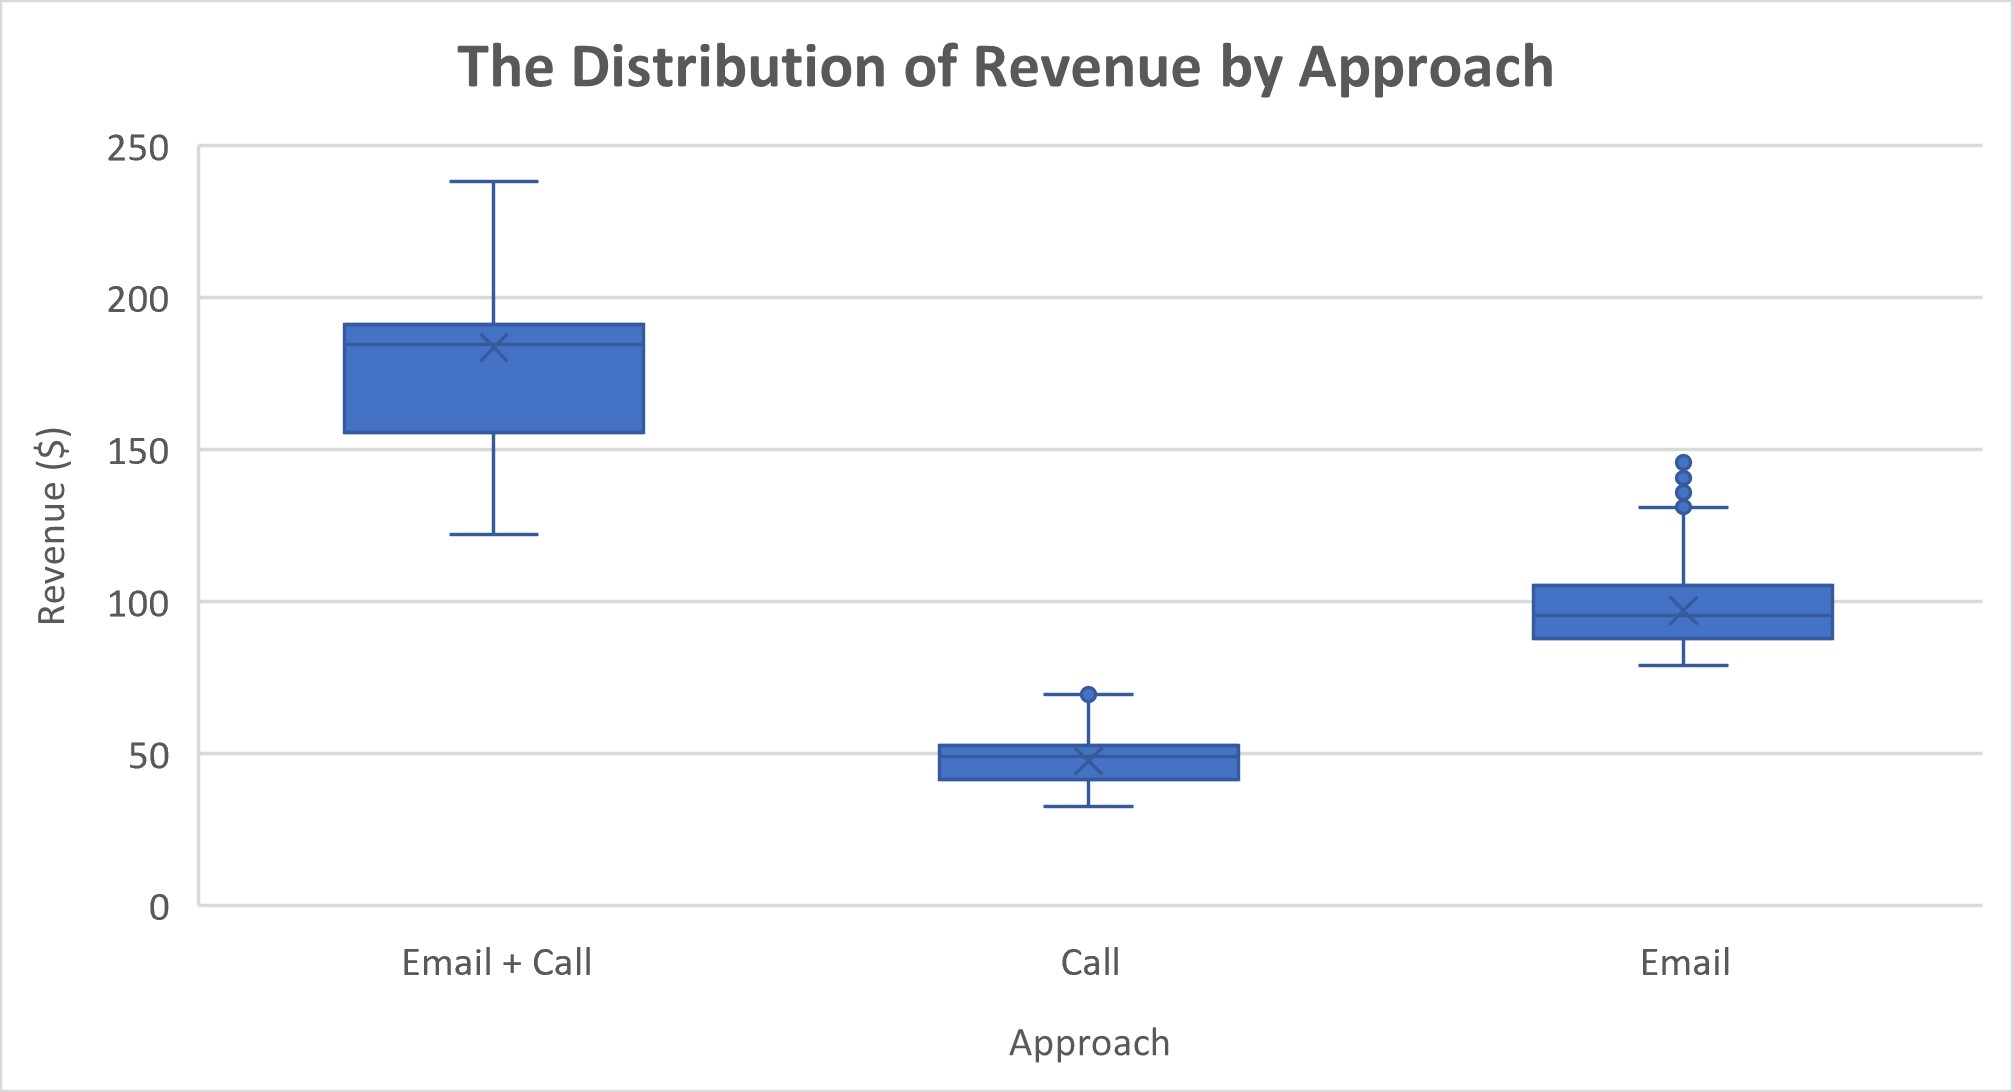
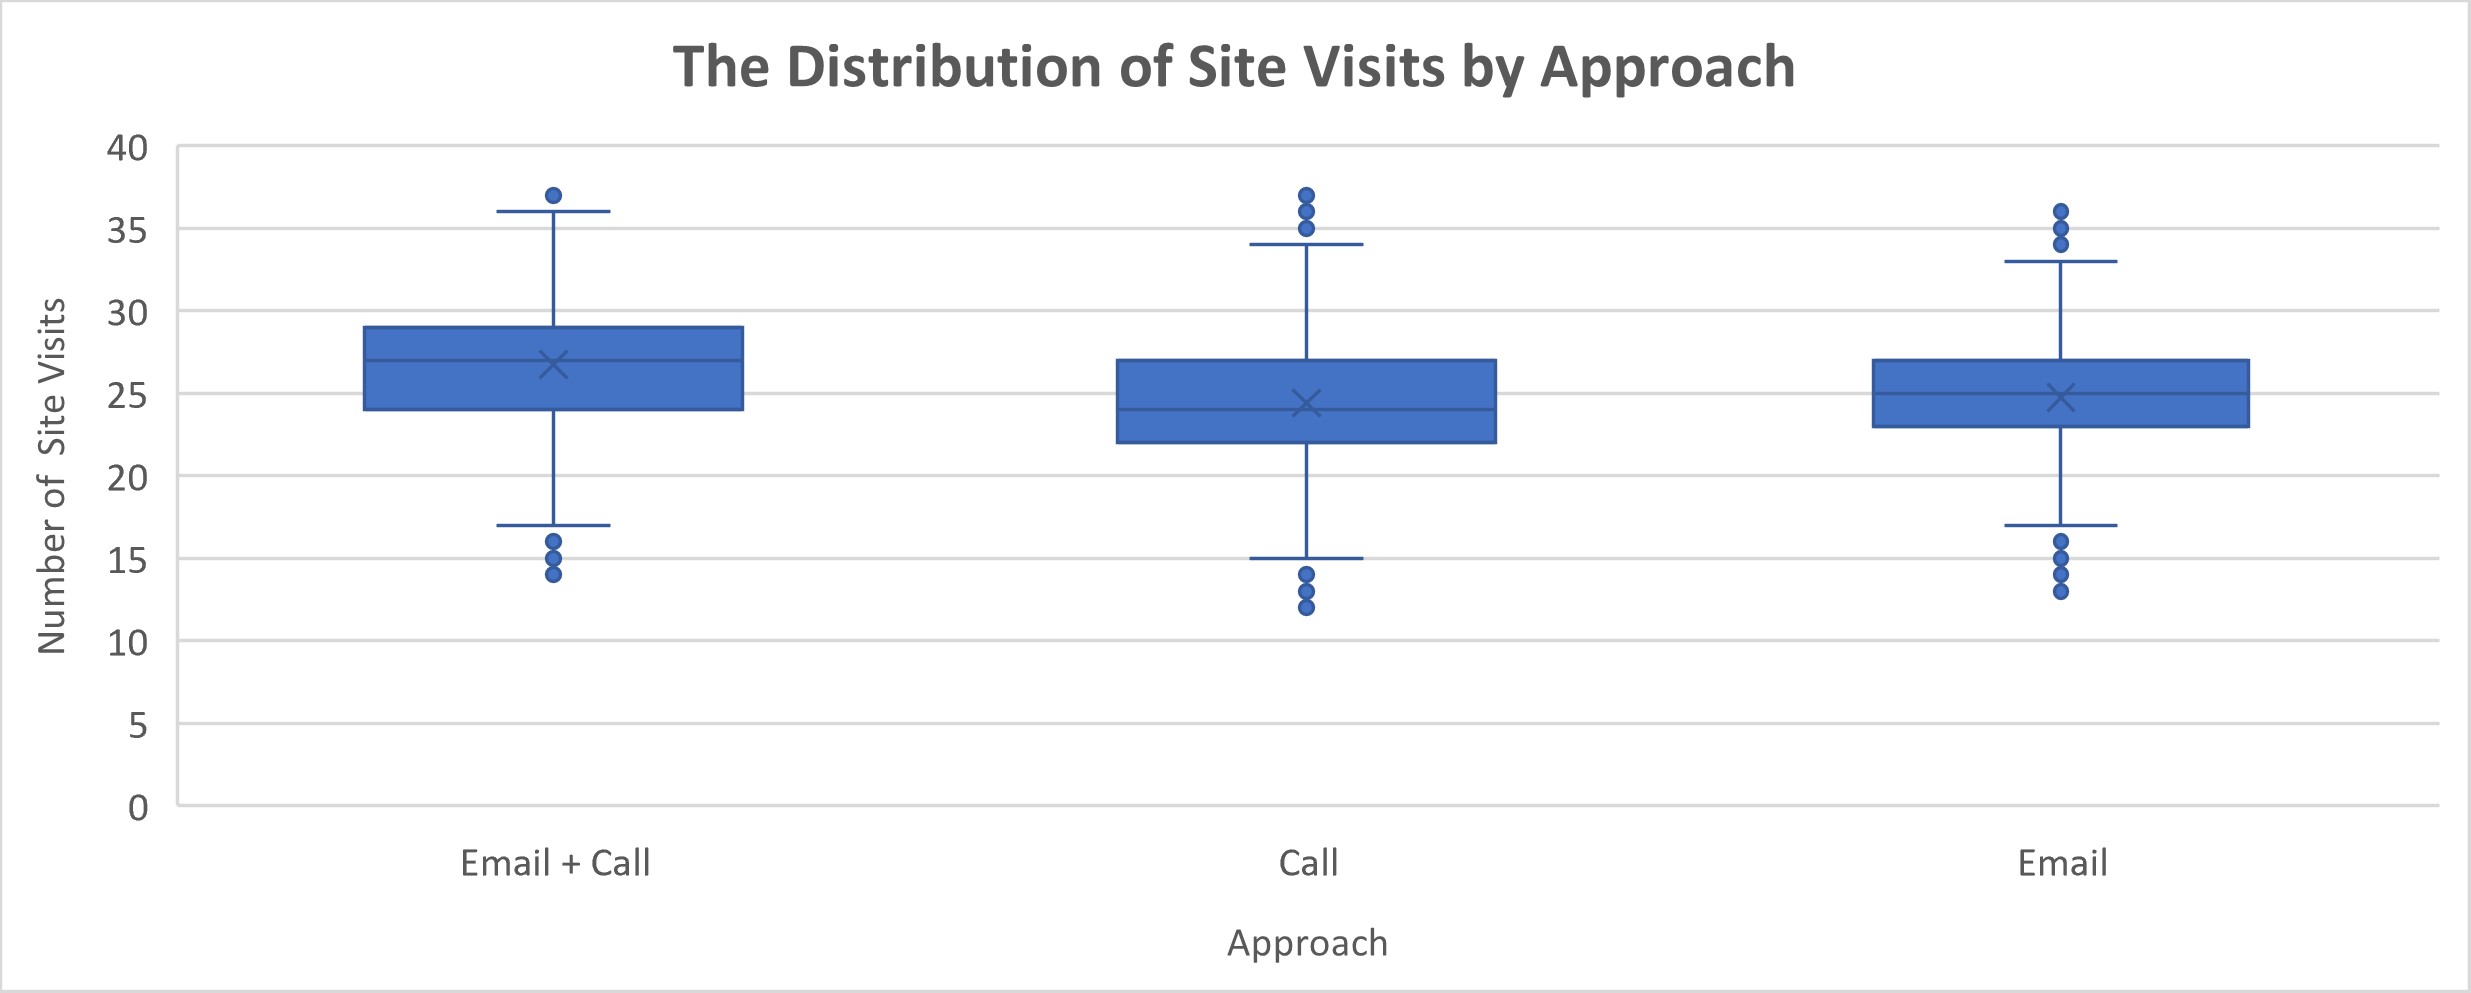
The distribution of revenue per ID by revenue can explain why the combination of email and call ranked 2nd based on the total revenue. It is obvious that the combination of the email and call approach improved the revenue and the number of new products sold per customer ID according to the two comparison plots below. My guess is that the combination method may enhance customers' memory with stronger new product exposure based on the distribution of site visits among the three approaches.
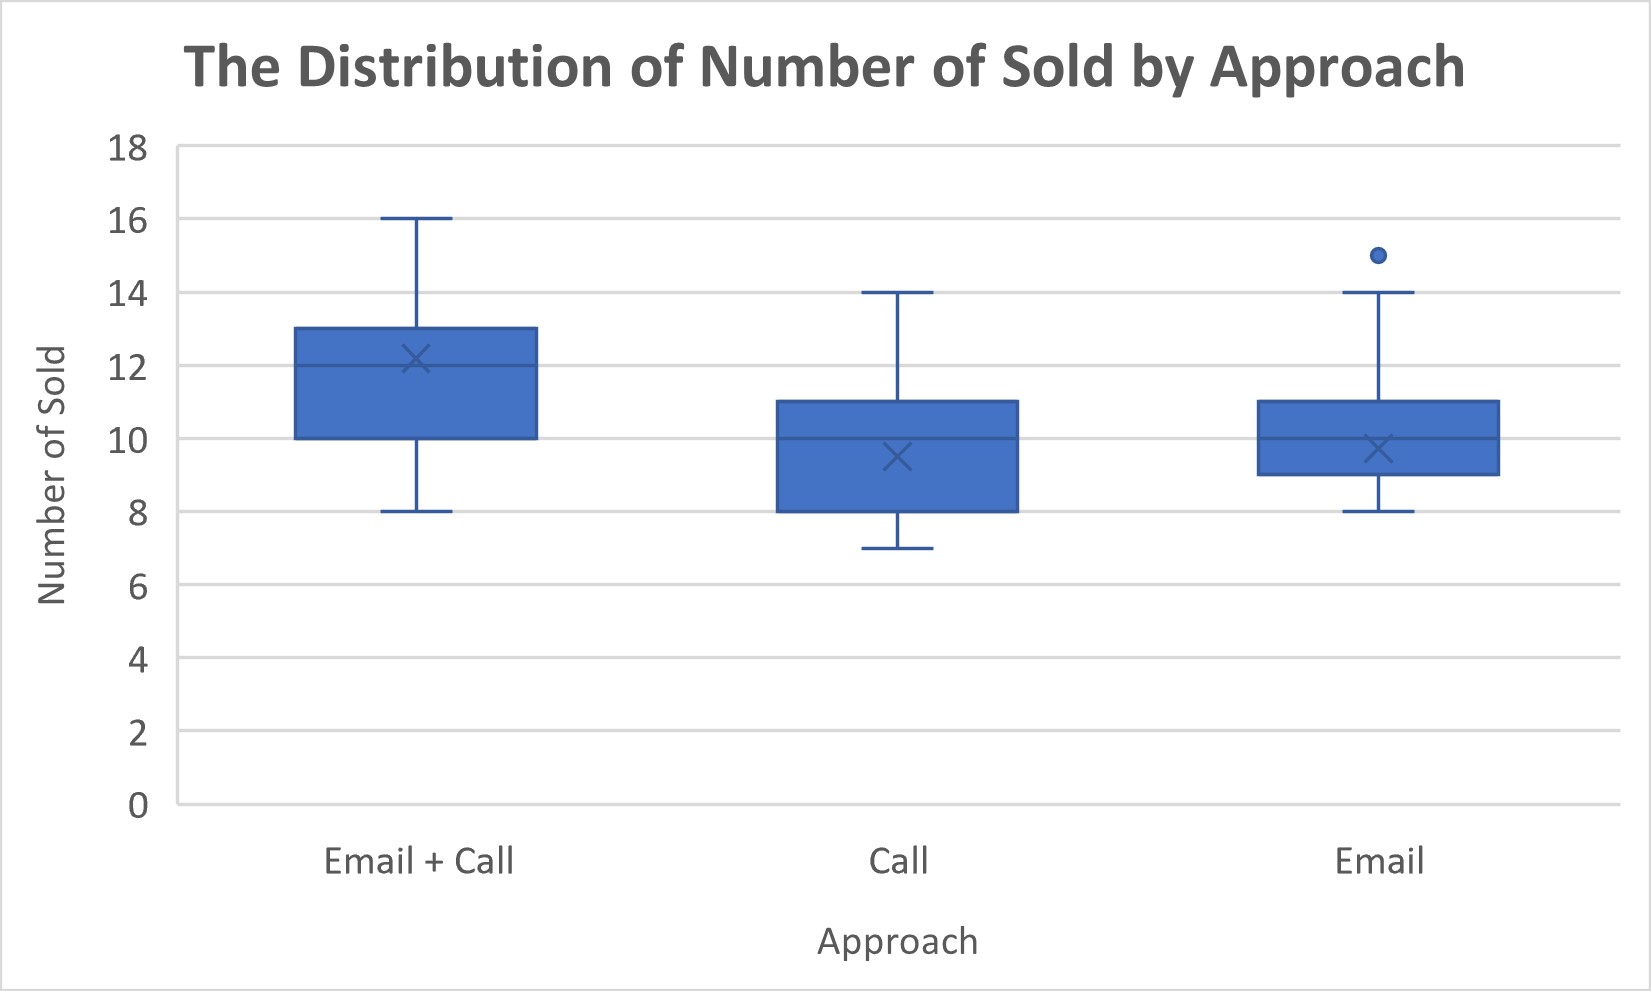
From the multiple boxplots below, we can see the visits and revenue per ID range in the combination of email and call is more significant than only email and call. Especially, the revenue ranges from 155 to 190 USD, which is much higher than email and call approaches.
According to the distribution of site visits and the number of sold boxplots, the combination of email and call enhanced customers' interest then customers checked our site more frequently and ordered our products more.
Chapter 3 Customer Persona
Before exploring more about approaches, it is time to look at the customer persona over 6 weeks.
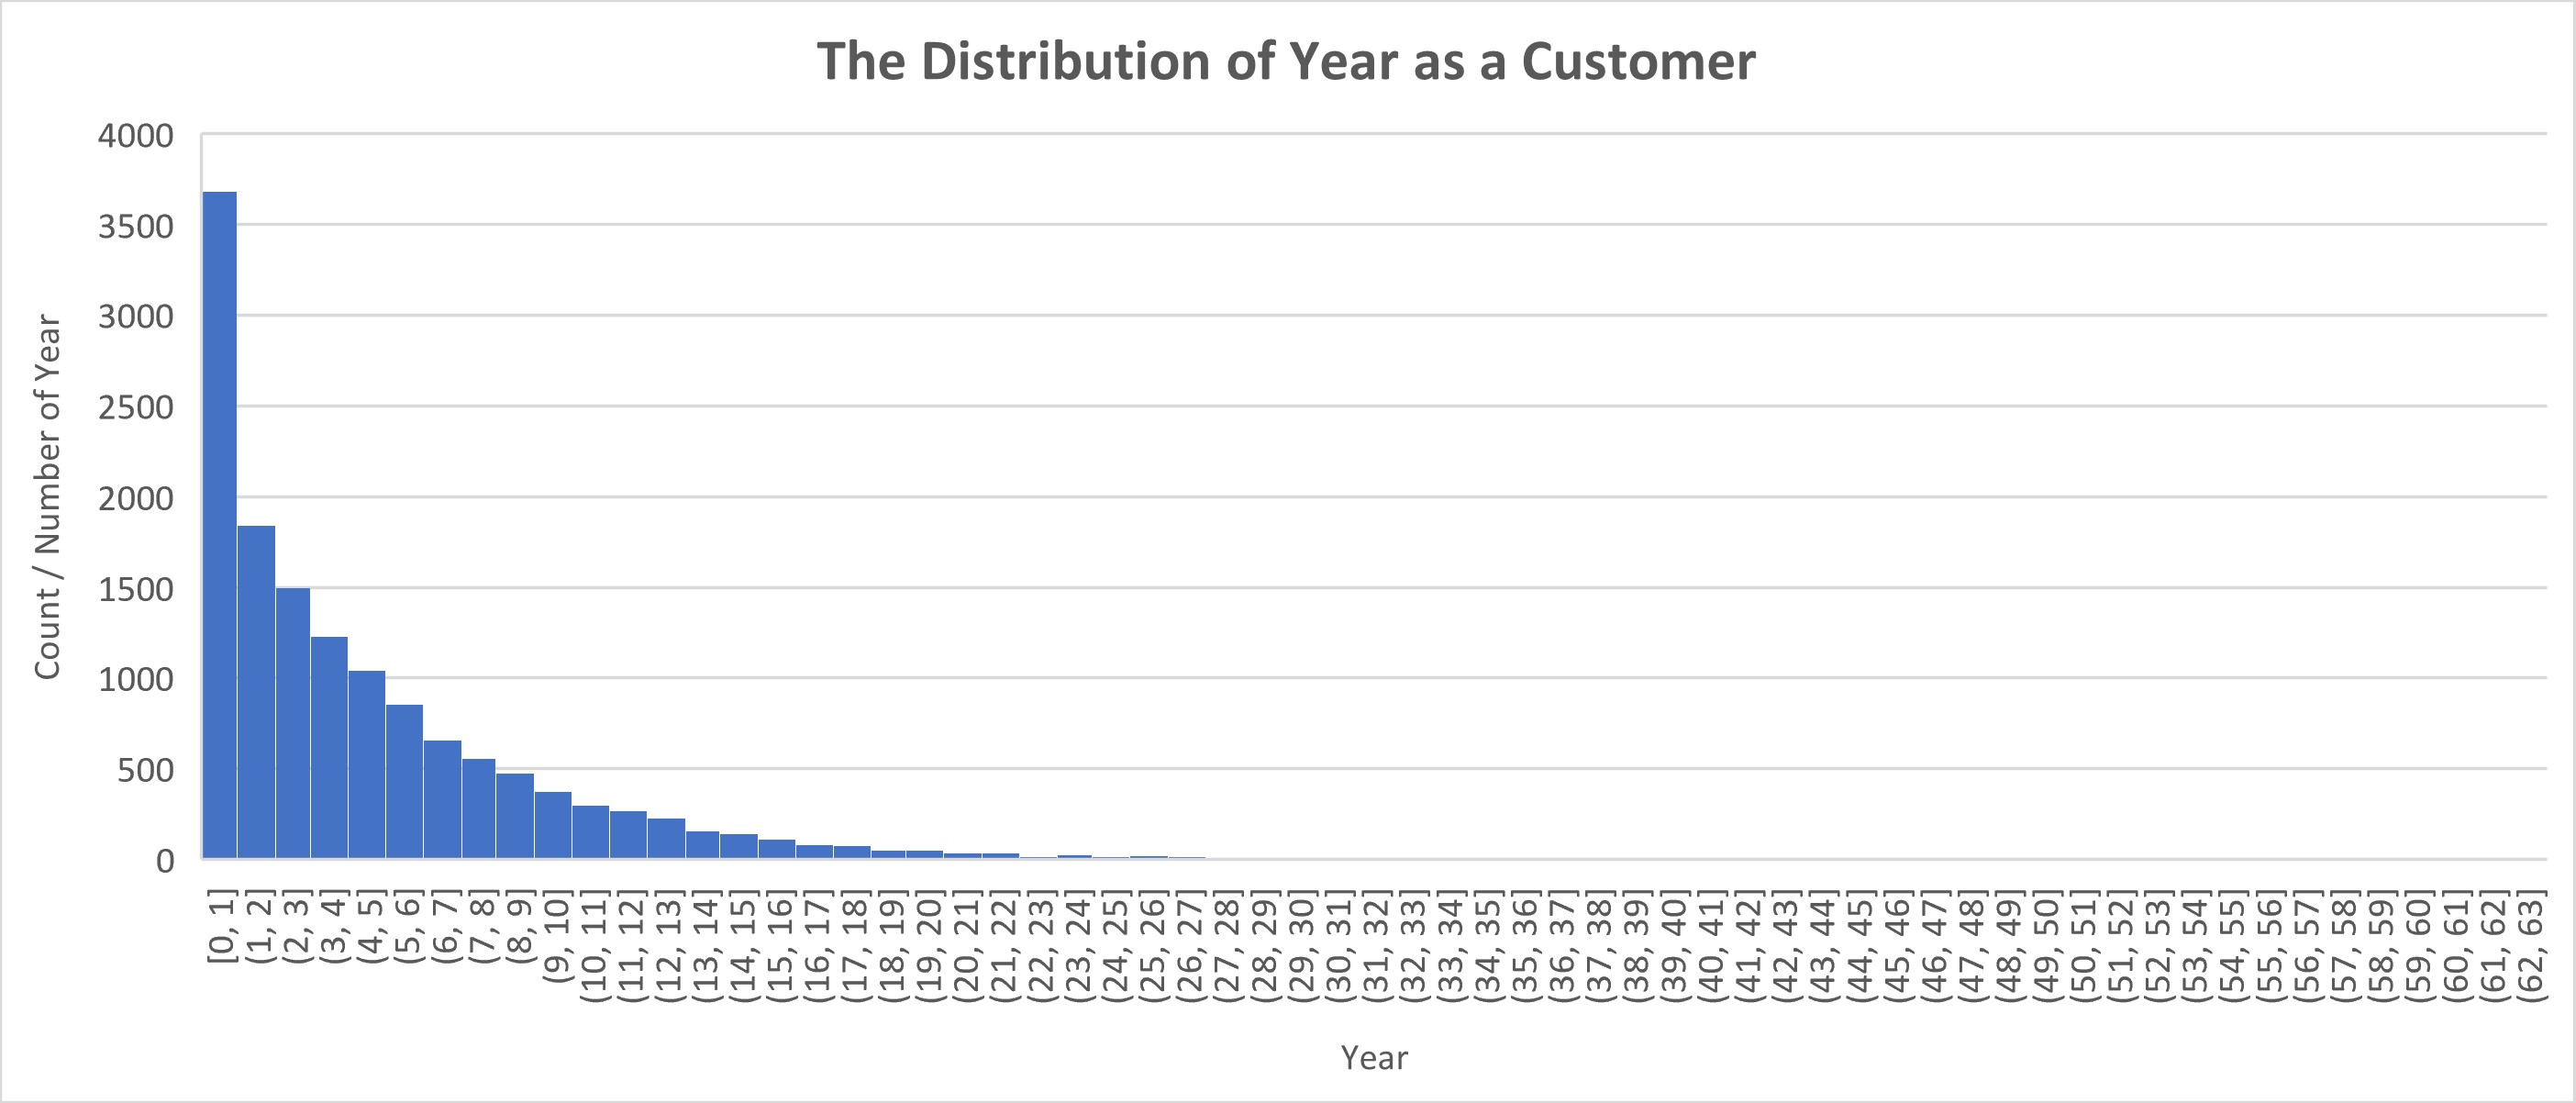
The Distribution of Years as a Customer
Around 1/4 of customers started buying from us in one year and most of our old customers keep in touch with us for no more than 10 years. It is vital for each company to decrease churn rate and so do we.
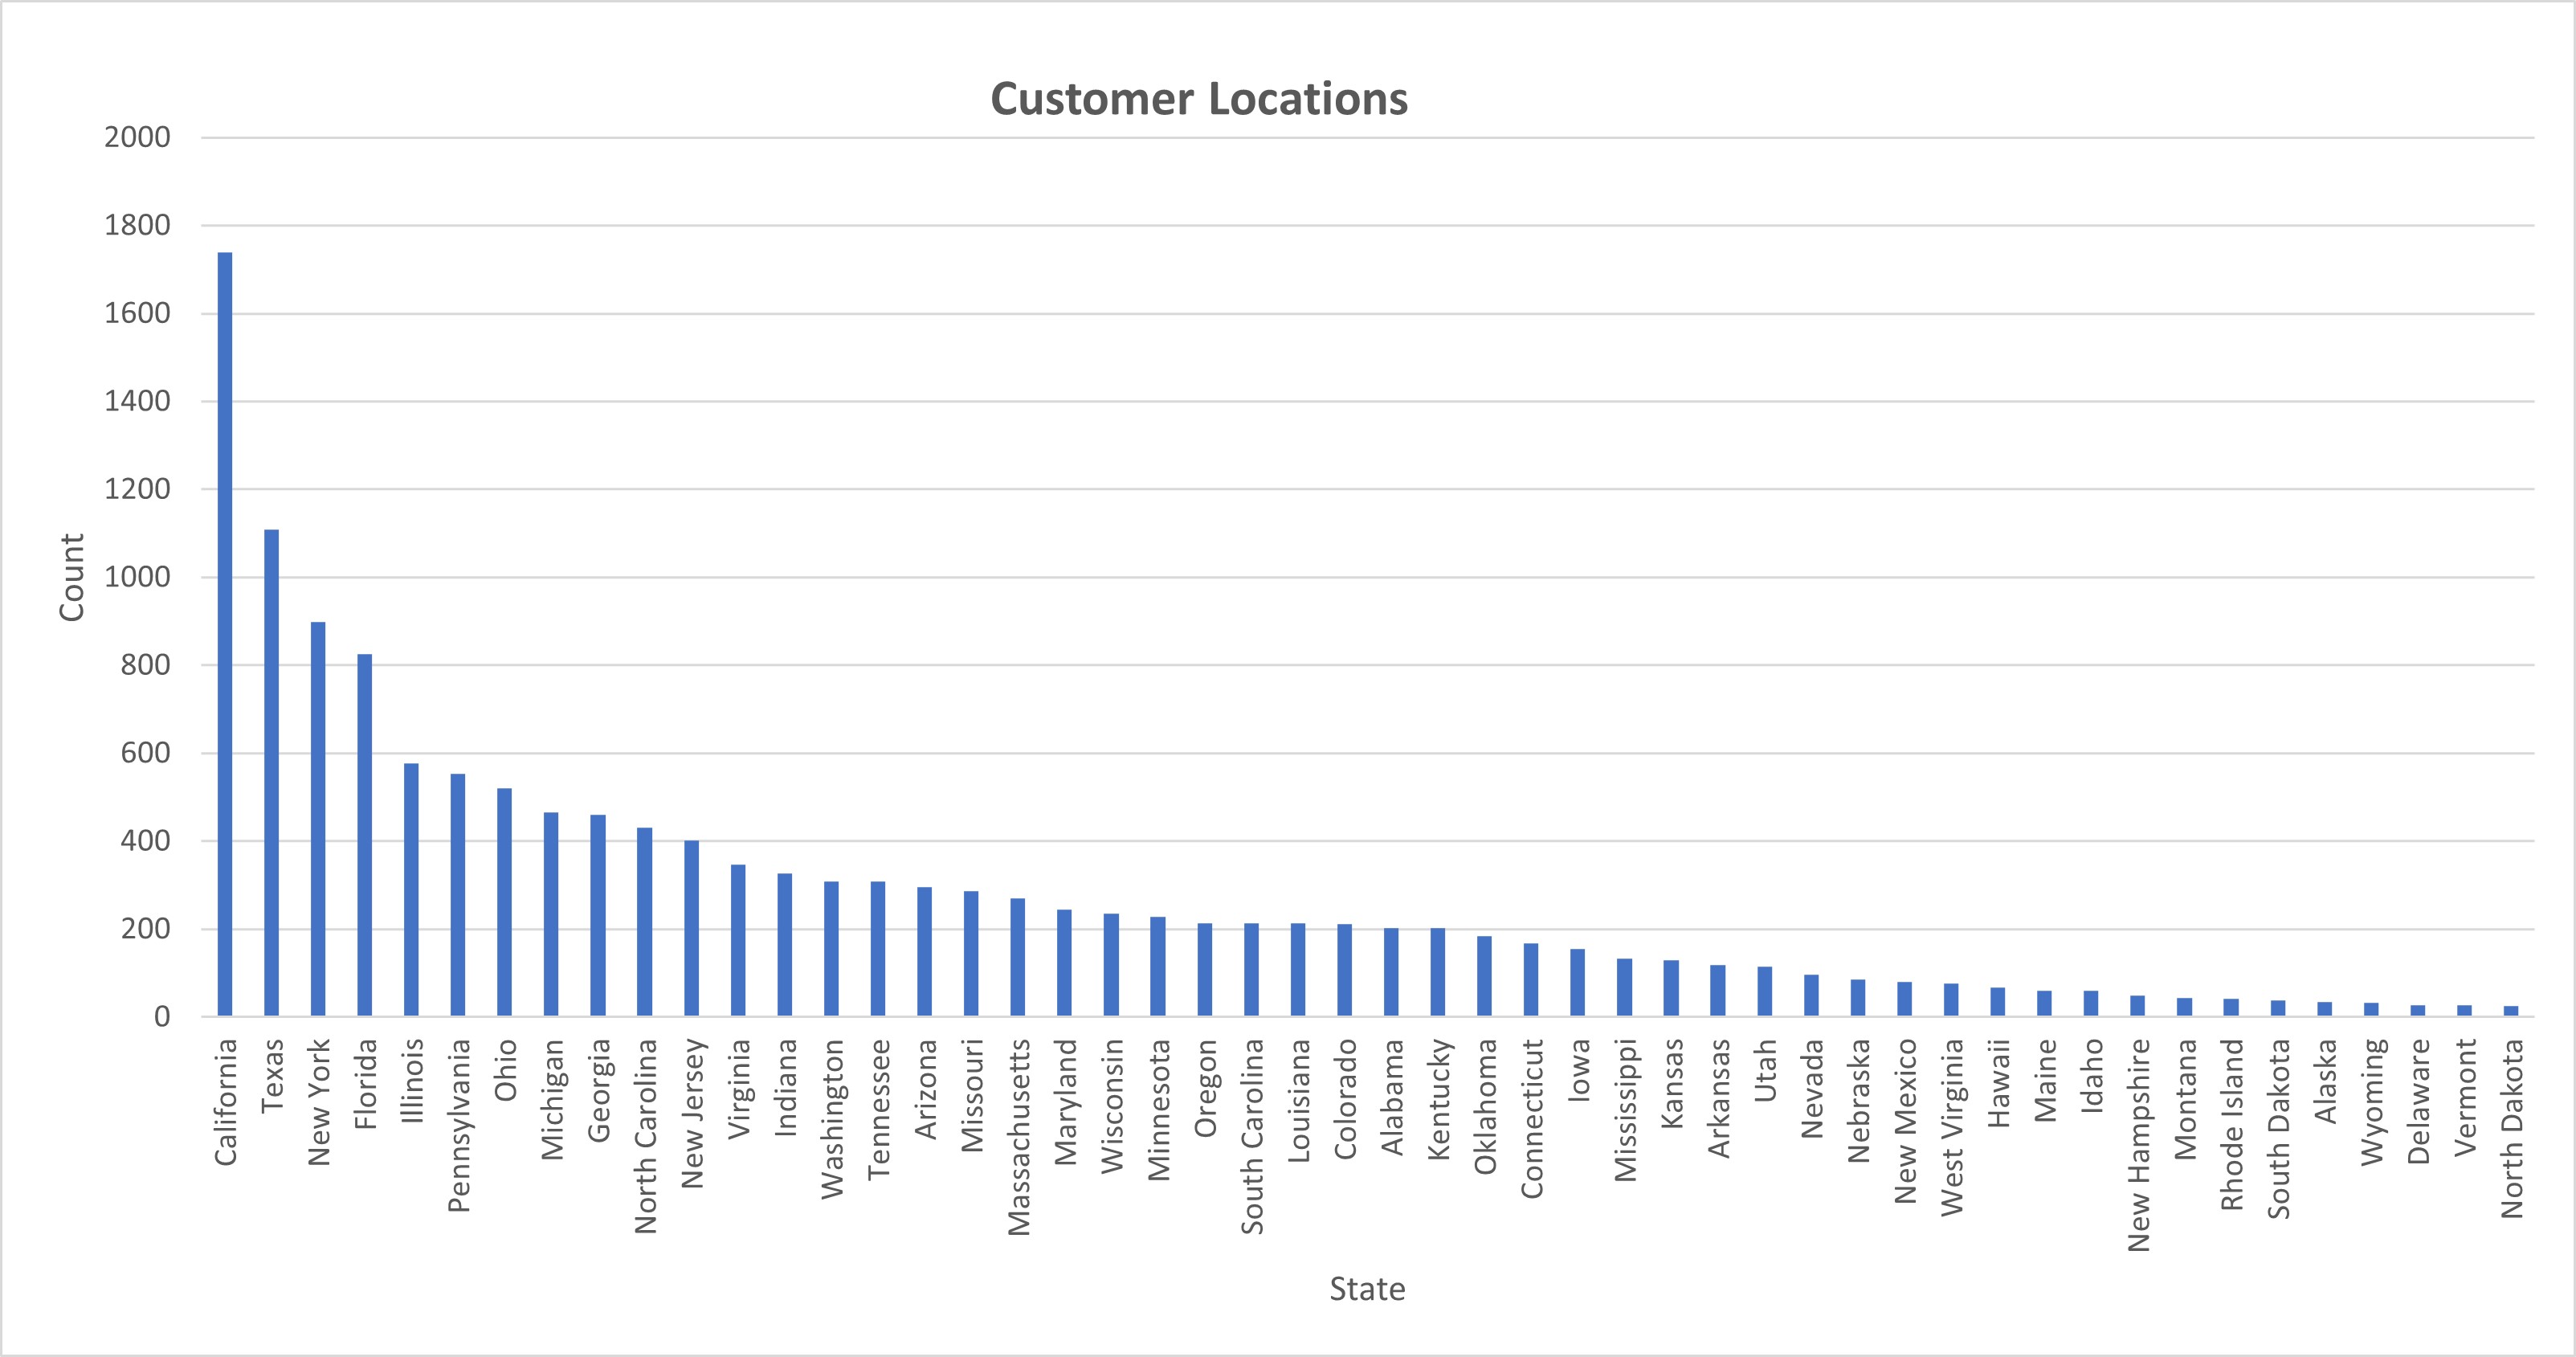
The Distribution of Customer Location
Ranking the first three cities are California, Texas and New York. It is understandable that these cities have numerous companies that need stationery and other office products. Actually, there is a potential market in small cities that deserve advertising.
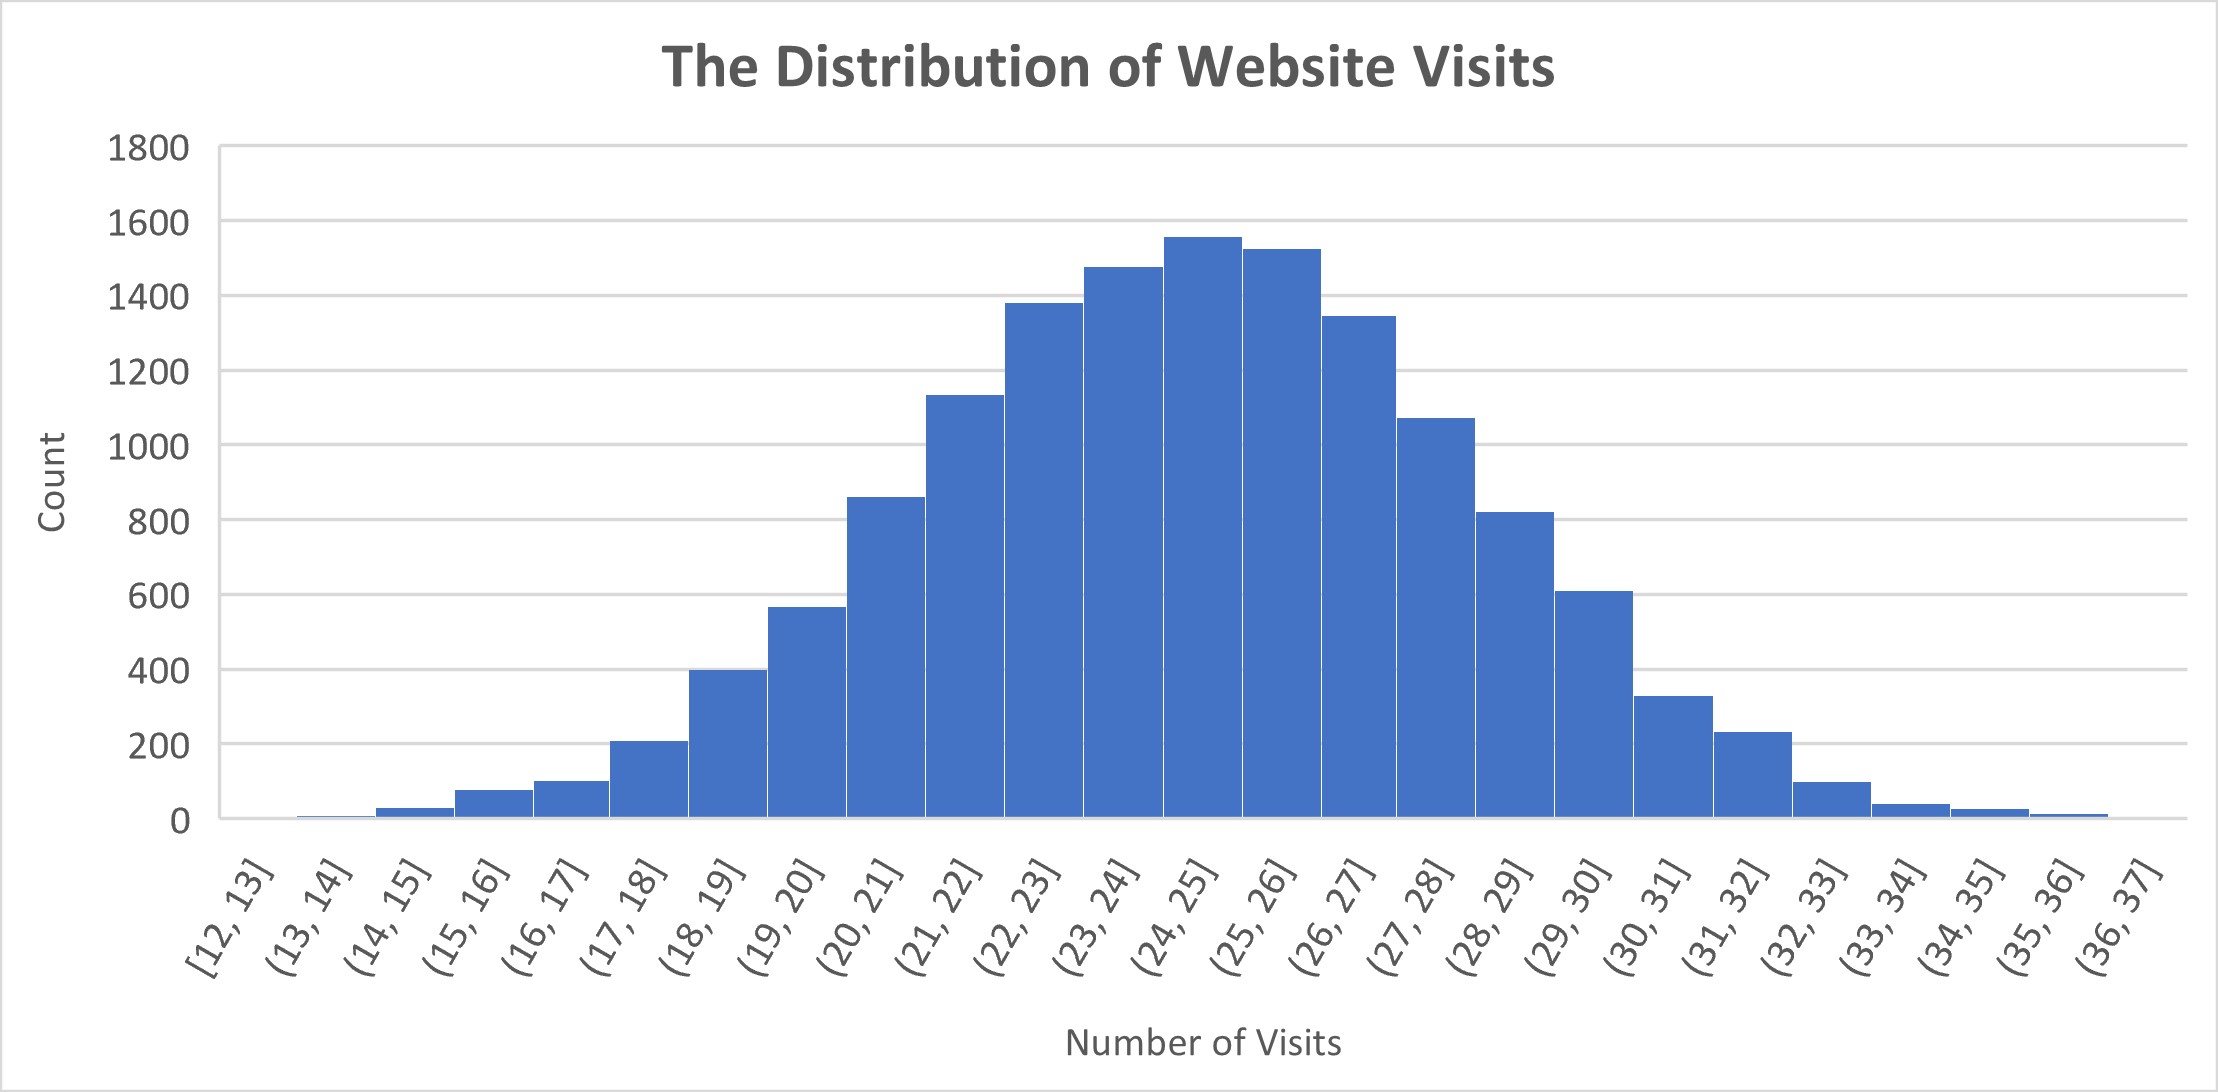
The Distribution of Website Visits
Customer activity is an essential metric to evaluate, during the last 6 months, the most frequent customer visit is about 25 times.
Chapter 4 Changes with Time
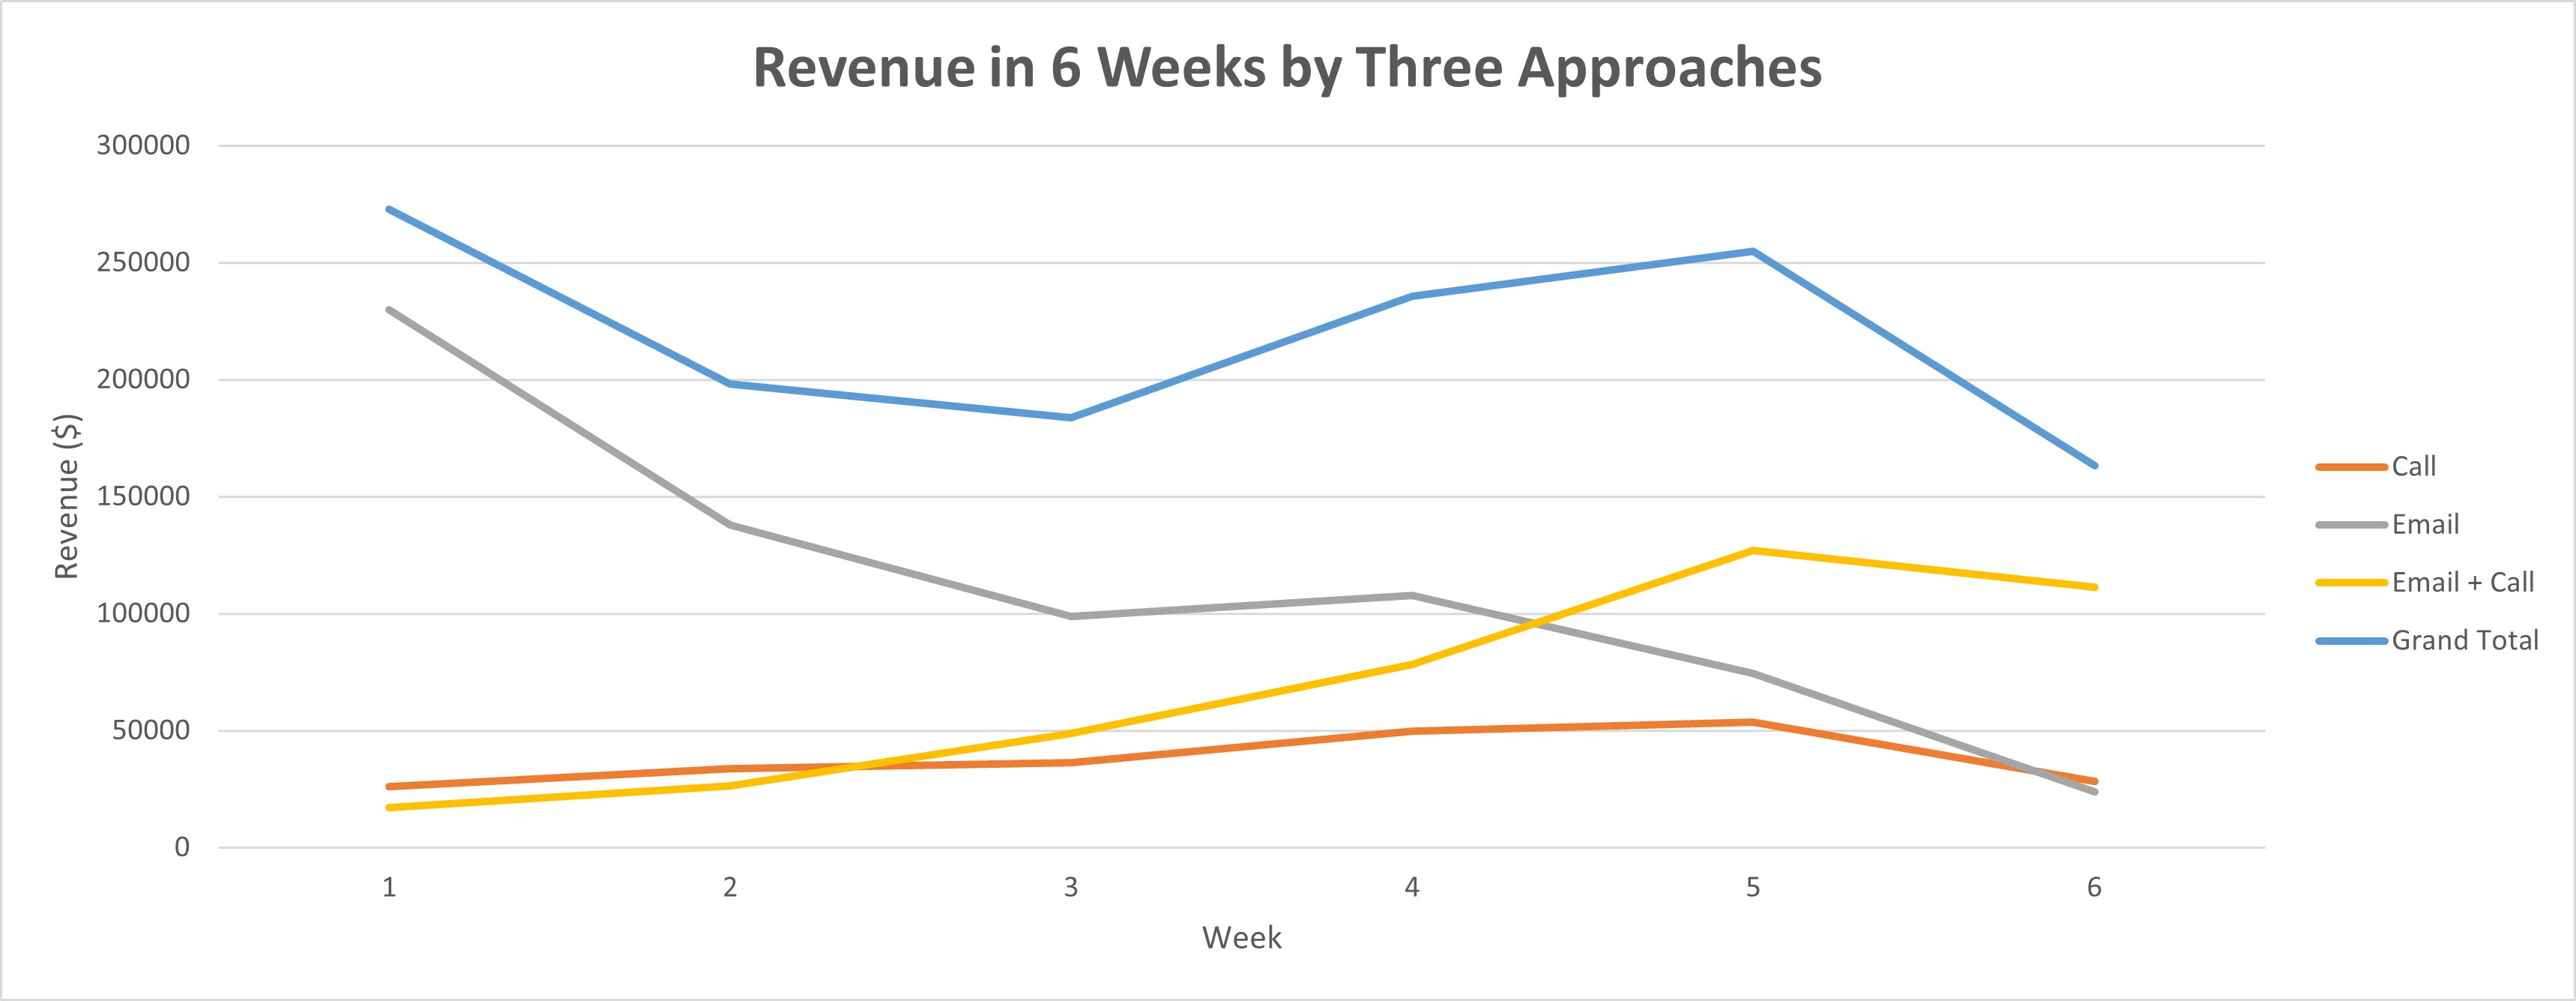
The Spread of the Revenue in 6 Weeks
The total revenue in each week shows a general decreasing trend with time. In week 1, the new line was launched and most of our customers got notifications via email or call. The fact is that customers' interest decreased with time, which is the reason why the total revenue decreased.
When we focus on the difference in trend in the three approaches, The situation of the three approaches changed.
email approach promoted customers to purchase obviously in week 1, then reminded customers again in week 3.
call approach cost lots of time and work, so the effort was reflected in the middle of the 6 weeks.
email and call reminded customers two times and the revenue increased with time.
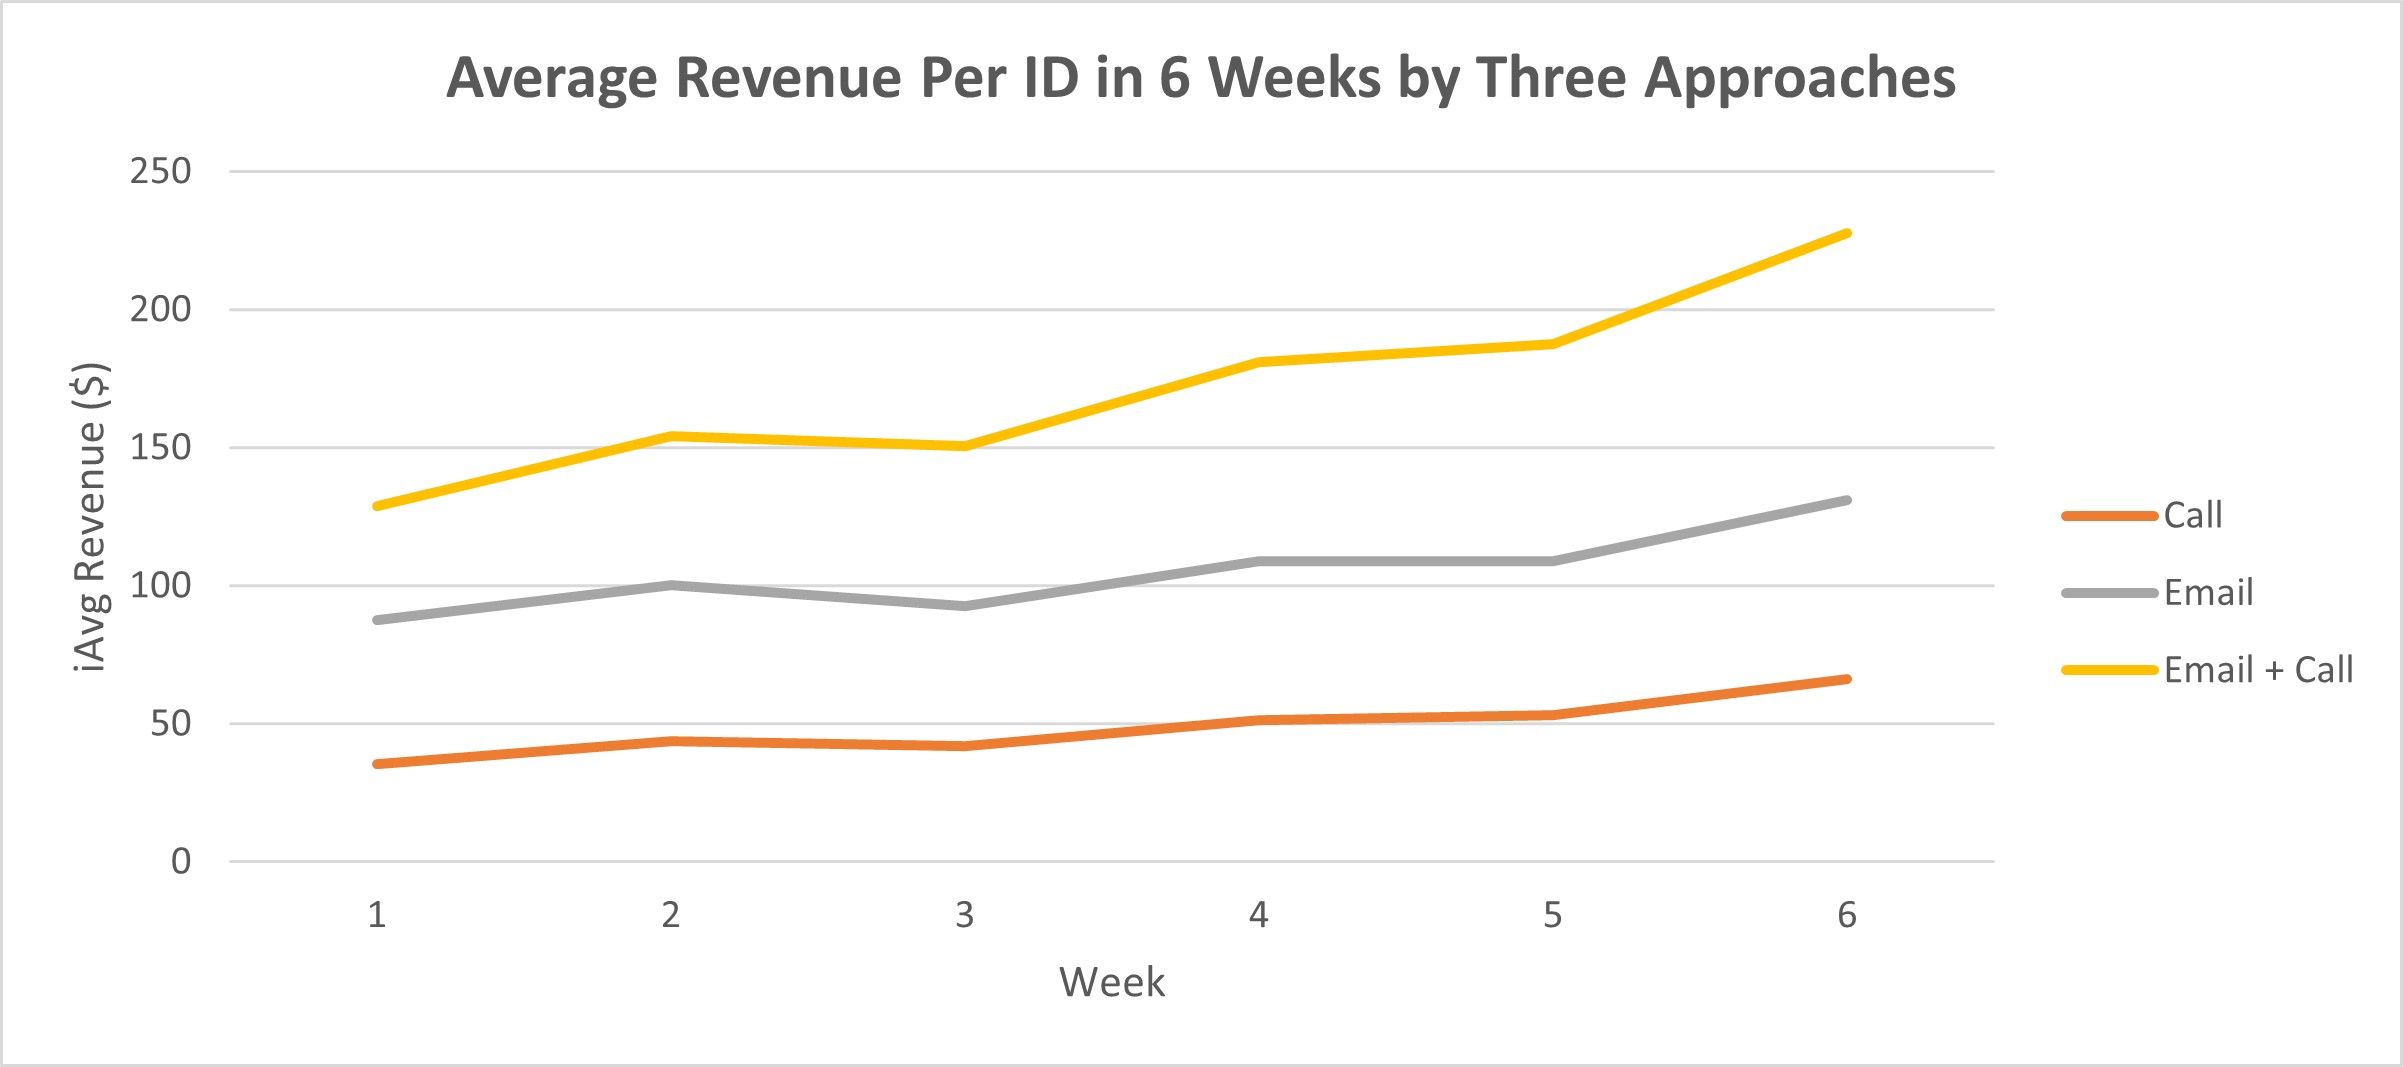
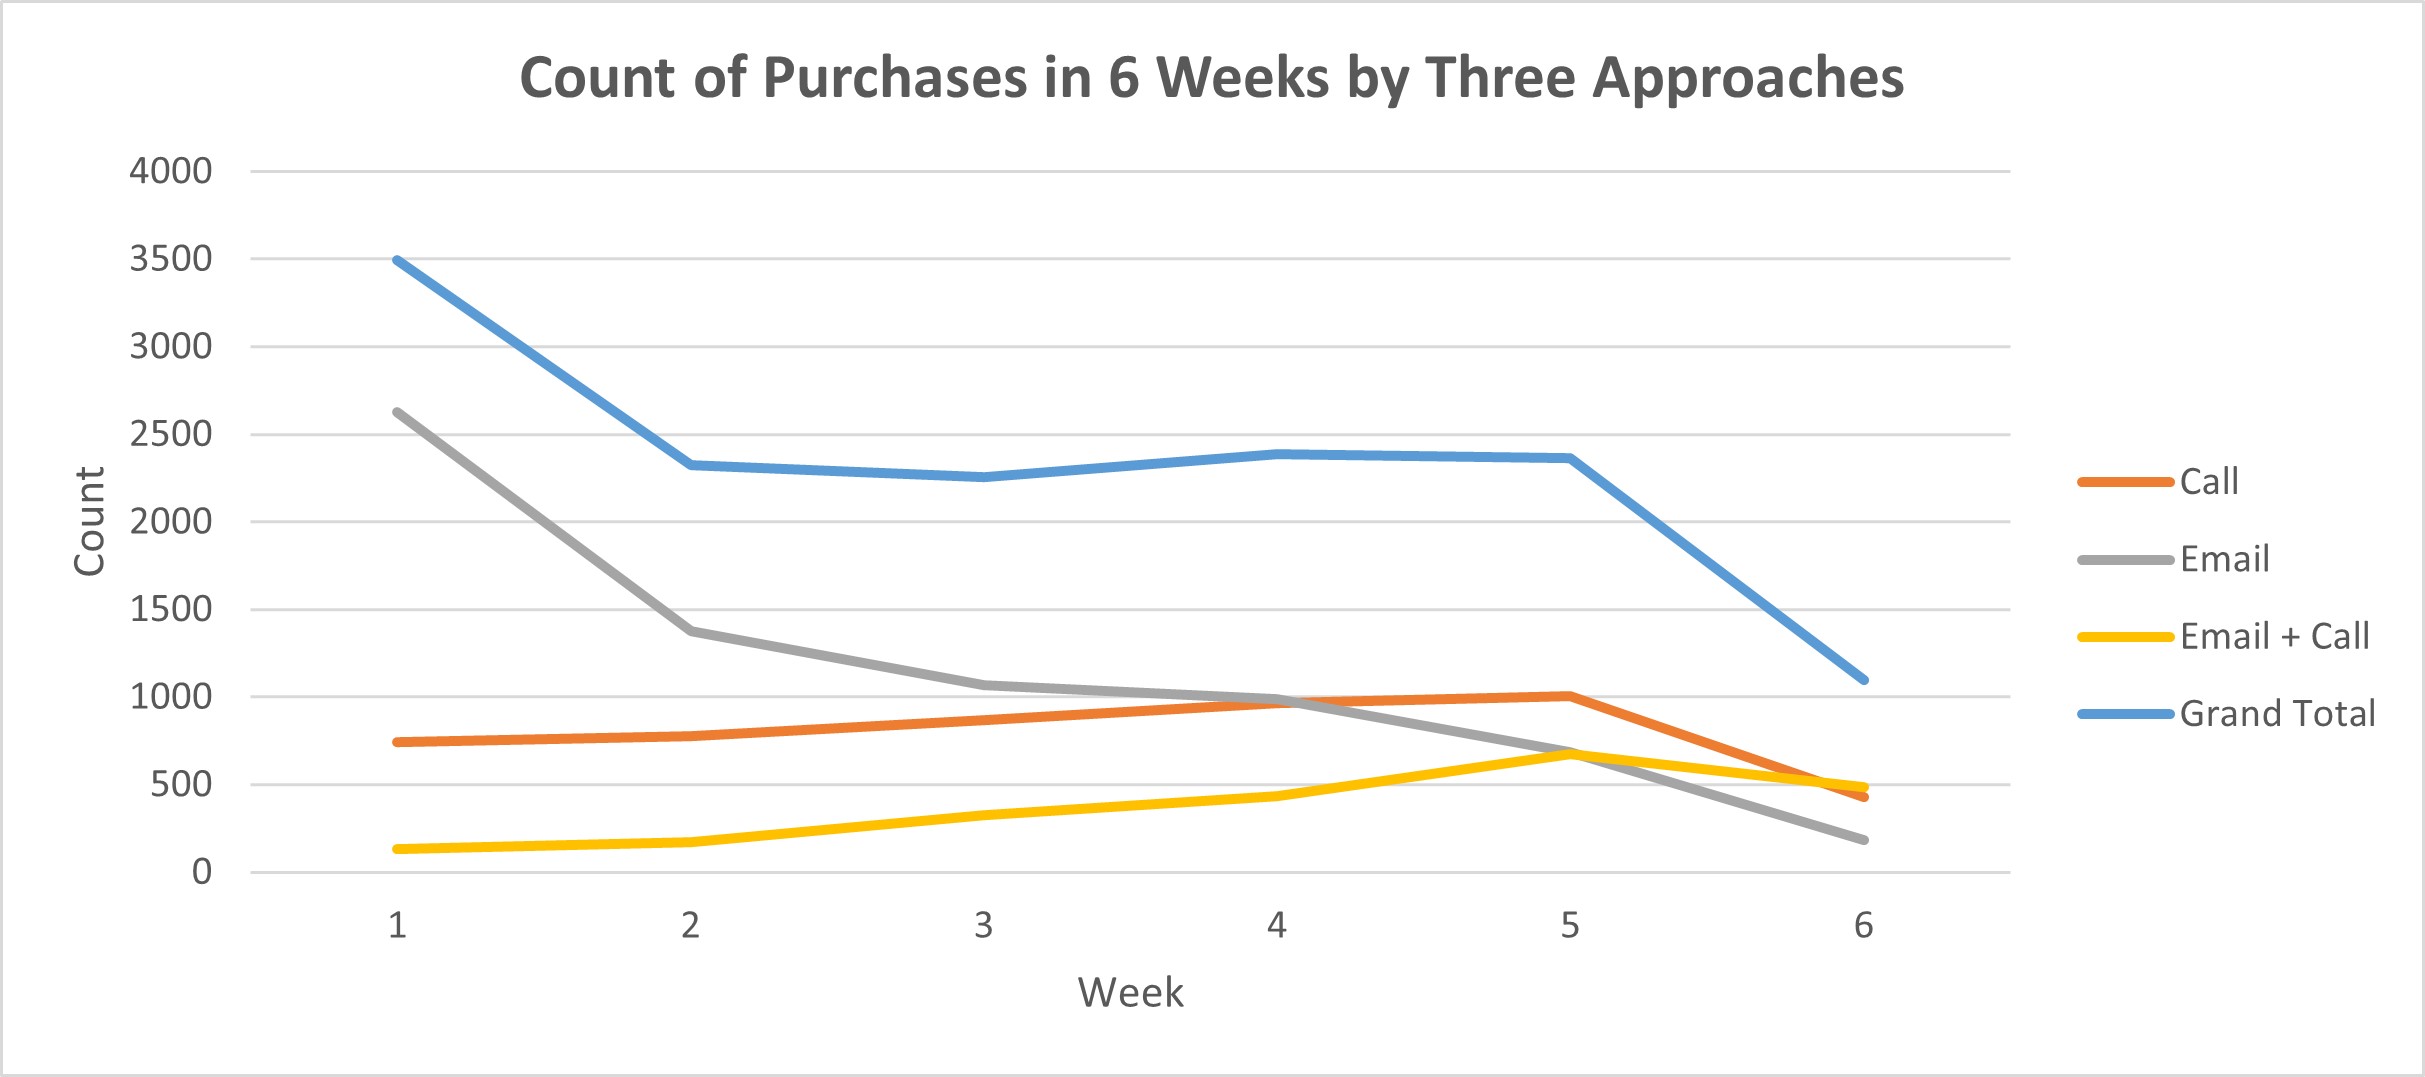
The Average Revenue and The Number of Purchases
Since the total revenue is decided by the average revenue and the number of purchases, it is essential to look at the trend of them with time by three approaches.
We can conclude that the average revenue per ID increased with time. As the report mentioned before and it can be confirmed that the combination of email and call prompted customers to spend more during one purchase action.
Then based on the trend of the number of purchases, email had immediate effects after sending out, so the number of purchases is highest in week 1 and then dropped dramatically. The trend is the same as the trend of total revenue.
Chapter 5 Discussion
Business Metrics
Since our goal is to decide which approach works well for the new product. I would recommend we use the total revenue coming from three approaches as our metric.
Based on our last 6 weeks' data, the combination of email and call contributed 408,259.69 dollars when the total is 1,308,138.01 dollars. Therefore, if the number is increasing, it means the new product is sold effectively.
Recommendation
I would recommend we can focus on the following steps:
Using key metrics to evaluate the performance of selling the new product.
Transforming Call sales strategy into the combination of email and call completely.
Adding the third email six weeks later after the new product launch to remind customers.
Data Collection for in-depth analysis
Improve data quality - Is there a possibility to fill the missing data in the revenue
Differentiate order id and customer id - Are there customers who purchase our products more than twice in 6 weeks